Disposable income falls further

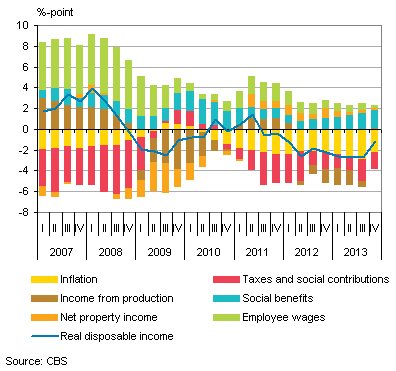
Real disposable income of Dutch households fell by 1.1 percent in the fourth quarter of 2013. Although real disposable income has been decreasing since the third quarter of 2011, this quarter the decrease was smaller than in the previous seven quarters. These developments are measured by moving annual totals: the figures for four quarters are combined and assigned to the last quarter.
Effects on year-on-year change in real disposable income

Most of disposable household income is made up of employee wages, social benefits, net property income and taxes and social contributions paid. Compared to the same quarter in 2012, employee wages were 0.3 percent lower, social benefits were 5.2 percent higher, mainly because of the higher number of unemployed: 437 thousand people were claiming unemployment benefit at the end of 2013, almost 100 thousand more than twelve months previously. Net property income was higher as households received over 1 billion euros more in dividends. Social contributions and taxes paid remained at about the same level. Prices rose by 2.2 percent on average. Without this price increase, disposable household income would have risen.
Financial wealth increases
Financial wealth of Dutch households increased by 23.8 billion euros to 1,197 billion euros in the fourth quarter of 2013. Financial wealth comprises mainly savings, securities and money put into pension funds; pension funds are not controlled by the households themselves but do count towards their wealth. Mortgage debt accounts for the largest part of households’ financial liabilities.
Share profits pushed up financial wealth.The value of share portfolios held by households grew by 6.2 billion euros from the previous quarter. Households sold more shares than they bought, but the outstanding wealth increased because of the positive returns on their investments. The amounts held by pension funds also increased because of these profitable developments on the stock market. Also, the net contribution to these funds was positive.
Change in households’ wealth compared to the previous quarter

The mortgage debt of households decreased for the fifth quarter in a row. Overall, households repaid more on existing loans than they took out in new loans in 2013: 8 billion euros net. This is the first time in 20 years that the household mortgage debt decreased on a year-to-year basis. Low interest rates and fear of residual debt after selling are possible explanations for the reduced mortgage debt.
