Automatically detect solar panels with aerial photos
Solar power is an important renewable energy source. This article explains the research conducted by Statistics Netherlands to map the numbers and locations of solar panels more accurately using deep learning methods.
Development
The CBS statistics on solar power have improved in a number of areas over the past year. CBS has published an extensive article on this subject. Until recently, the CBS statistic on solar power was based on a survey among about 300 suppliers and importers of solar panels. In the meantime, a method has been adopted whereby the installed capacity is derived from registers, including the Production Installation Register (PIR) and data from CertiQ. The result of the new method is that figures can be reported at a lower level of detail.
In practice, the registration of solar panels is not mandatory in the Netherlands. The PIR used by Statistics Netherlands is therefore not fully covered, see for example the recent publication on this subject by Stedin, the Dutch grid operator. With a new study, CBS wants to investigate whether the numbers and locations of solar panels can be determined more accurately in a European context by making additional use of analysis of aerial photographs.
Deep Solaris
In the research project "Deep Solaris" CBS collaborates with the Open University and the statistical offices of Flanders and Germany to get a complete and detailed picture of installed solar panels. Part of this project is the delivery of an interactive map with the locations of solar panels in Flanders, North Rhine-Westphalia and Limburg. These locations are automatically determined on the basis of aerial photographs. From these locations regional statistics with numbers of solar panels can be made.
This article explains which experiments have been carried out with the application of different models to aerial photographs of, among others, the state of California (USA), the state of North Rhine-Westphalia (Germany) and the province of Limburg (the Netherlands). The result of these experiments is that two models emerged as the best. These models will be used in the continuation of the project to provide the first interactive map, which will also use aerial photographs of Flanders.
Project approach
In this research project various machine learning techniques were investigated, such as random forest (RF), support vector machine (SVM) and convolutional deep neural networks (CNN). The purpose of these techniques is to classify automated images, see figure 1.
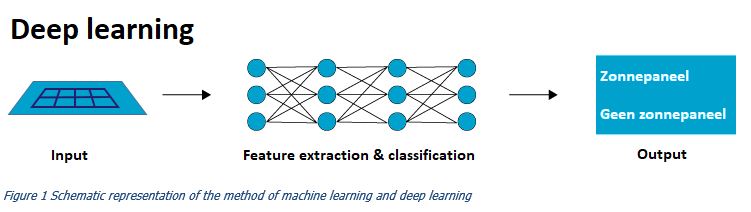
This article explains the results of the application of five CNN models: VGG16, InceptionV3, InceptionResNetV2, DenseNet and Xception. These models are publicly available in the Keras library. The models are trained on aerial photographs of various urban landscapes, using existing registers to train and validate the algorithms developed.
Weights from the ImageNet Large Scale Visual Recognition Competition (ILSVRC) were used as the starting point for the models. In this competition different algorithms are tested on how well they perform in detecting objects and classifying different images. Detection of solar panels is not part of this competition.
With the aforementioned selection of CNN models, 3 experiments have been carried out, in which the models are assessed on different properties:
- Accuracy: What percentage of the roofs are correctly recognized (positive or negative)
- Precision: What percentage of the recognized solar panels is actually a solar panel
- Recall: What percentage of the actual solar modules are recognized as such
- F1-score: Number between 0 and 1, based on the precision and recall. 1 means perfect precision and recall.
Experiment 1 – Transfer learning
Research goal
Investigate to what extent models that have already been trained for other applications can also be used for the detection of solar panels.
Used models
InceptionV3, InceptionResNetV2, DenseNet and Xception in different variants: without, with partial and with full transfer learning. The models are trained and tested on a dataset of North Rhine Westphalia.
Results
The Xception model with full transfer learning yielded the best results (highest f1 score), see figure 3. The accuracy is shown for the result obtained when applied to both the training set and the test set.
| Transfer learning approach | Test accuracy | Training accuracy | F1score |
|---|---|---|---|
| No transfer learning | 0.8 | 0.79 | 0.83 |
| Full transfer learning | 0.82 | 0.81 | 0.84 |
| Partial transfer learning | 0.81 | 0.81 | 0.82 |
Experiment 2 – Generalisation
Research goal
Investigate how well trained models perform when applied to aerial photographs of other areas
Used models
Xception from experiment 1 (full transfer learning), trained and used on aerial photographs of North Rhine Westphalia and California.
Results
The Xception model from experiment 1 is trained on pictures of North Rhine Westphalia. The results when applied to a dataset of California are - without additional training - clearly worse. By completely re-training the model, the results are already slightly better, but surprisingly enough, the best result is obtained if the model is only partially (a few layers) re-trained. The same goes for the application at NRW. With partial and especially full re-training, the model will perform worse, probably because of 'overfitting'. The accuracy is shown for the result obtained when applied to both the training set and the test set.
| Training approach | Test accuracy | Training accuracy | F1score |
|---|---|---|---|
| No retraining | 0.82 | 0.81 | 0.84 |
| Full retraining | 0.65 | 0.66 | 0.74 |
| Partial retraining | 0.78 | 0.77 | 0.81 |
| Test accuracy | Training accuracy | F1score | |
|---|---|---|---|
| No retraining | 0.72 | 0.73 | 0.73 |
| Full retraining | 0.72 | 0.73 | 0.78 |
| Partial retraining | 0.81 | 0.81 | 0.83 |
Experiment 3 – Generalisation and cross-validation
Research goal
Investigating whether the end result will be better if two models are applied and the results of the models are compared.
Models used
Xception from experiment 1 (full transfer learning) as well as VGG16 (partial transfer learning). The models were trained at Bradbury (California) and applied to Aachen (North Rhine Westphalia), Fresno (California) and Limburg.
Results
The Xception model has better precision, recall and f-score than the VGG16 model. The VGG16 model, on the other hand, generalizes better than Xception because the latter model seems to over fit the data. When applying Xception to the Aachen dataset, the accuracy and precision deteriorates rapidly.
| Bradbury | Fresno | Aachen | |
|---|---|---|---|
| Xception | 0.98 | 0.98 | 0.53 |
| VGG16 | 0.93 | 0.94 | 0.82 |
Provisional conclusion
The results of the experiments show that the models used can be used successfully to classify solar panels from aerial photographs. The best performing models, Xception and VGG16, achieve training and test accuracy of over 90%.
Follow-up steps
The first interactive map is expected in February 2019. In addition, a scientific peer-reviewed paper is being prepared for submission at the end of Q1 2019. One of the next steps in the research is to investigate to what extent satellite data can be used for the detection of (large-scale) solar installations.
Privacy measures
Statistics Netherlands always publishes data in such a way that no recognizable data about an individual person, household, company or institution can be derived from it. Although in this project public data (aerial photographs, satellite images) are used as a basis for the analysis, the interactive maps will only show numbers of solar panels at an aggregated level.
Acknowledgement
This research is carried out under the ESS action 'Merging Geostatistics and Geospatial Information in Member States' (grant agreement no.: 08143.2017.001-2017.408) and a CBS investment for the development of a Deep Learning algorithm.
For more information about CBS's efforts to improve its solar power statistics, see the publication 'Smart solar power mapping'.