Harvest of potatoes and seed onions at long-term average despite drought
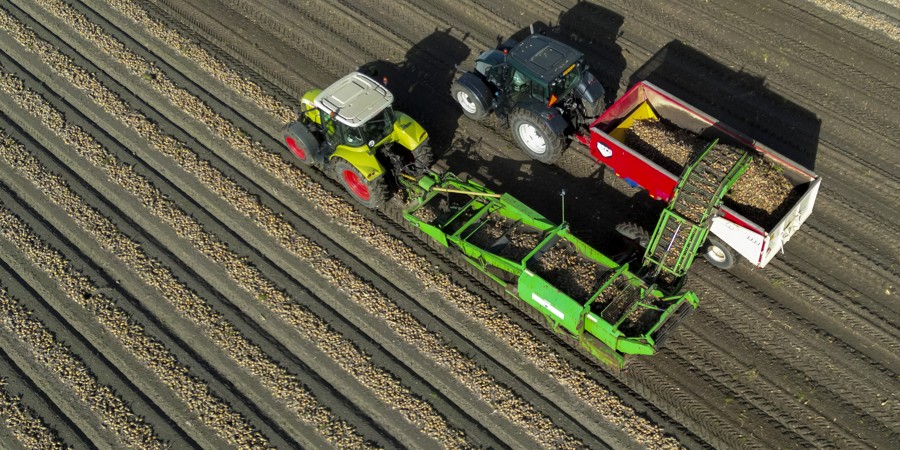
According to the provisional crop yield estimates, the gross yield for ware potatoes in 2026 is up by 17 percent on 2025. Harvests for seed onions are expected to be 15 percent lower. Despite the dry weather conditions in 2026, yields are comparable to the ten-year long-term average. Both crops had record yields in 2025. Yields for sugar beets this year are below average, mainly due to a reduction in the area under cultivation. This is according to figures from the provisional arable crop yield estimates published by Statistics Netherlands (CBS).
| Jaartal | Sugar beets (million tonnes) | Sugar beets: 10-year average (million tonnes) | Ware potatoes (million tonnes) | Ware potatoes: 10-year average (million tonnes) | Seed onions (million tonnes) | Seed onions: 10-year average (million tonnes) |
|---|---|---|---|---|---|---|
| 2017 | 8.0 | 6.8 | 4.0 | 3.6 | 1.5 | 1.4 |
| 2018 | 6.5 | 6.8 | 3.1 | 3.6 | 0.9 | 1.4 |
| 2019 | 6.6 | 6.8 | 3.7 | 3.6 | 1.4 | 1.4 |
| 2020 | 6.7 | 6.8 | 3.7 | 3.6 | 1.3 | 1.4 |
| 2021 | 6.6 | 6.8 | 3.3 | 3.6 | 1.5 | 1.4 |
| 2022 | 7.3 | 6.8 | 3.6 | 3.6 | 1.2 | 1.4 |
| 2023 | 6.9 | 6.8 | 3.4 | 3.6 | 1.3 | 1.4 |
| 2024 | 6.4 | 6.8 | 3.3 | 3.6 | 1.5 | 1.4 |
| 2025 | 7.3 | 6.8 | 4.2 | 3.6 | 1.8 | 1.4 |
| 2026* | 6.0 | 6.8 | 3.5 | 3.6 | 1.5 | 1.4 |
| * provisional figures | ||||||
A large harvest in 2025 led to a surplus of potatoes. As a result, arable farmers scaled back potato cultivation in 2026. The total area used to grow ware potatoes was relatively small this year, at 70.3 thousand hectares.
The gross yield per hectare was 49.5 tonnes, nearly 3 percent lower than in 2025. The total gross yield for ware potatoes is estimated at 3.5 million tonnes, 17 percent lower than in 2025, but in line with the yields recorded over the past ten years.
Smaller cultivated area and lower yields for seed onions
The total area used to grow seed onions had been increasing for a long time but appears to have peaked. Compared with 2025, the area has decreased by 1 percent to 32.6 thousand hectares. This decline is due to a 15 percent reduction in the area used to grow red seed onions. The area used to cultivate yellow seed onions, however, increased by 2 percent.Gross yields for seed onions are estimated at 45.7 tonnes in 2026, 14 percent lower year on year. 1.3 million tonnes of these yields are yellow seed onions and 0.2 million tonnes are red seed onions.
The total gross harvest of seed onions is estimated at 1.5 million tonnes, 15 percent lower than last year. Altogether, 1.3 million tonnes of yellow onions and 0.2 million tonnes of red onions were harvested. Due to the smaller area used to cultivate red seed onions, the harvest is 25 percent lower, while that of yellow seed onions is 12 percent lower.
More second-year seed onions and set onions than ever before
The gross yield for second-year seed onions and set onions is 9 percent higher. Never before have so many second-year seed onions and set onions been grown: 7.0 thousand hectares. The gross yield per hectare is 5 percent lower, however.Second-year onion sets are grown and harvested in their first year, and then replanted in the spring of the second year. Because the plant has already had a chance to grow, it can be harvested earlier, meaning that these onions are exposed to this summer’s heat and dry weather conditions during a shorter period.
Increased onion losses due to extreme weather conditions
The total loss of seed onions and second-year onion sets may be higher in 2026 due to a greater risk of diseases caused by bacteria and fungi, among other things. This was partly due to extreme weather such as drought, heavy rainfall or hailstorms. Farmers are also restricted in their use of pesticides. The term ‘loss’ refers to onions that have been harvested but are unsuitable for further processing.
| Jaartal | Total seed onions (million tonnes) | Yellow seed onions (million tonnes) | Red seed onions (million tonnes) | Second-year onion sets (million tonnes) |
|---|---|---|---|---|
| 2017 | 1.45 | |||
| 2018 | 0.89 | |||
| 2019 | 1.37 | |||
| 2020 | 1.31 | 0.28 | ||
| 2021 | 1.47 | 0.32 | ||
| 2022 | 1.02 | 0.20 | 0.27 | |
| 2023 | 1.16 | 0.16 | 0.26 | |
| 2024 | 1.27 | 0.20 | 0.29 | |
| 2025 | 1.44 | 0.30 | 0.30 | |
| 2026* | 1.26 | 0.23 | 0.33 | |
| * provisional figures ¹⁾Data on second-year set onions has been available since 2020; the breakdown between yellow and red seed onions has been available since 2022. | ||||
1.2 million tonnes fewer sugar beets
Sugar beet production has had to be scaled back in 2026 due to European measures aimed at curbing surpluses and restoring balance to the sugar market. As a result, area restrictions have been imposed on growers, and the area used to cultivate sugar beets has decreased by nearly 12 percent compared to last year. The gross yield per hectare is estimated at 86.0 tonnes.
This brings the total gross yield to 6.0 million tonnes, almost 17 percent lower than last year.
| Categories | Sugar beets (tonnes) | Ware potatoes (tonnes) | Seed onions (tonnes) |
|---|---|---|---|
| 2017 | 93.3 | 52.8 | 55.7 |
| 2018 | 76.4 | 41.2 | 35.5 |
| 2019 | 83.9 | 47.9 | 50.3 |
| 2020 | 82.1 | 48.6 | 49 |
| 2021 | 81.2 | 46.7 | 49.1 |
| 2022 | 88.8 | 47.1 | 44.5 |
| 2023 | 86.3 | 45.8 | 45.7 |
| 2024 | 75.2 | 43.4 | 46.8 |
| 2025 | 91.2 | 50.8 | 53.2 |
| 2026* | 86.0 | 49.5 | 45.7 |
| * provisional figures | |||
Provisional and definitive crop yield estimates
At the end of June, Statistics Netherlands published figures on the cultivated area of arable crops. The estimated yields per hectare have now been added to these figures, which were estimated by experts on the basis of the latest information available.Experts say there are significant differences in yields between plots that can be irrigated and those that cannot. 33 percent of arable farmers indicated in the combined yield declaration that they have their own irrigation systems for agricultural land. This means that leased or borrowed systems are not included in this figure. Which plots have actually been irrigated or to what extent is unknown.
CBS calculates gross yields on the basis of the total cultivated area and the estimated crop yields per hectare. The final crop figures for 2026 will be released in late January 2027. These are based on a survey on arable farming.
Sources
- StatLine - Arable crops; production, by region