Inflation up on Bonaire and Saba, down on Statia
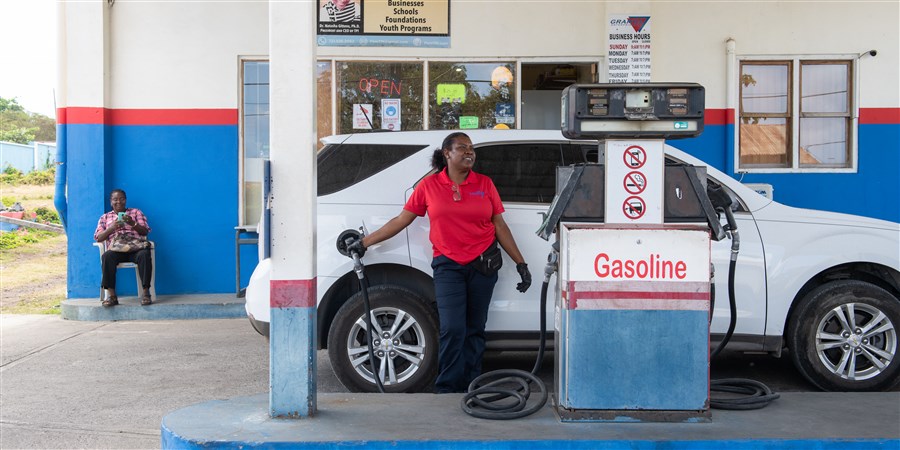
In the third quarter of 2026, consumer goods and services on Bonaire were 5.9 percent more expensive, year on year. Inflation in Q2 was 3.3 percent. Statistics Netherlands (CBS) reports this on the basis of the consumer price index for the Caribbean Netherlands.
On St Eustatius, prices were up by 4.5 percent, year on year in Q3 2026. In Q2, inflation stood at 5.2 percent. On Saba, inflation was 5.2 percent in Q3, compared to 5.0 percent in Q2.
| Groep x-as label | X-as label | Bonaire (year-on-year % change) | St Eustatius (year-on-year % change) | Saba (year-on-year % change) |
|---|---|---|---|---|
| 2017 | Q1 | 0.1 | 1.1 | -1.0 |
| 2017 | Q2 | 0.4 | 2.6 | -1.0 |
| 2017 | Q3 | 0.6 | 2.1 | -1.3 |
| 2017 | Q4 | 1.2 | 1.8 | 2.5 |
| 2018 | Q1 | 3.9 | 2.0 | 2.9 |
| 2018 | Q2 | 3.0 | 1.2 | 3.2 |
| 2018 | Q3 | 3.5 | 1.1 | 4.4 |
| 2018 | Q4 | 3.4 | 1.1 | 0.0 |
| 2019 | Q1 | 0.7 | 0.7 | 0.6 |
| 2019 | Q2 | 1.1 | 0.4 | 0.5 |
| 2019 | Q3 | 1.2 | 0.7 | 0.3 |
| 2019 | Q4 | 2.2 | 1.0 | 0.8 |
| 2020 | Q1 | 1.0 | 1.2 | 0.4 |
| 2020 | Q2 | -1.0 | -0.8 | -0.8 |
| 2020 | Q3 | -4.8 | -3.3 | -1.6 |
| 2020 | Q4 | -5.2 | -3.2 | -0.8 |
| 2021 | Q1 | -3.2 | -4.1 | -1.3 |
| 2021 | Q2 | 0.3 | -1.2 | 1.0 |
| 2021 | Q3 | 4.3 | 2.4 | 3.2 |
| 2021 | Q4 | 5.7 | 2.7 | 4.0 |
| 2022 | Q1 | 9.2 | 4.9 | 6.7 |
| 2022 | Q2 | 9.4 | 7.7 | 8.2 |
| 2022 | Q3 | 12.2 | 9.0 | 9.7 |
| 2022 | Q4 | 8.1 | 9.1 | 9.7 |
| 2023 | Q1 | 4.5 | 8.0 | 7.0 |
| 2023 | Q2 | 4.6 | 3.3 | 5.2 |
| 2023 | Q3 | 1.9 | 0.0 | 2.8 |
| 2023 | Q4 | 4.1 | -1.0 | 1.2 |
| 2024 | Q1 | 3.4 | -0.4 | 1.9 |
| 2024 | Q2 | 2.5 | 2.5 | 2.0 |
| 2024 | Q3 | 2.5 | 3.2 | 1.9 |
| 2024 | Q4 | 1.8 | 3.4 | 3.3 |
| 2025 | Q1 | 5.9 | 2.2 | 4.8 |
| 2025 | Q2 | 5.3 | 1.1 | 4.2 |
| 2025 | Q3 | 3.3 | 1.9 | 3.5 |
| 2025 | Q4 | 2.8 | 2.2 | 2.9 |
| 2026 | Q1 | 2.0 | 4.6 | 3.4 |
| 2026 | Q2 | 3.3 | 5.2 | 5.0 |
| 2026 | Q3 | 5.9 | 4.5 | 5.2 |
| * provisional figures | ||||
Prices on Bonaire up by 1.6 percent compared to Q2
Prices on Bonaire were up by 1.6 percent on average in Q3 2026, compared with Q2. This was mainly due to a rise in prices for transport of 5.8 percent. The price of petrol was up by 13 percent, while prices for airline tickets were up by 8.9 percent.
Prices for electricity rose by 15.2 percent, but prices for water fell compared with Q2.
Prices on St Eustatius up by 0.2 percent compared to Q2
On St Eustatius, prices were up by 0.2 percent in Q3 2026 compared with Q2. This was mainly due to a rise in prices for electricity of 15.2 percent. In addition, prices for clothing and footwear increased by 4.4 percent.
However, transport prices were down by 7.1 percent from Q2. This was mainly due to a fall in prices for airline tickets. Petrol, on the other hand, became 10.5 percent more expensive.
Prices on Saba up by 0.1 percent compared to Q2
On Saba, consumer prices were 0.1 percent higher in Q3 compared with Q2. Prices for clothing and footwear rose in particular.
However, transport prices fell by 6.7 percent. This was mainly due to lower prices for airline tickets. In addition, water charges decreased, while prices for electricity remained unchanged following the introduction of a new subsidy scheme.
| Jaar | Kwartaal | Bonaire (2017 =100) | St Eustatius (2017 =100) | Saba (2017 =100) |
|---|---|---|---|---|
| 2017 | Q1 | 99.5 | 99.0 | 99.4 |
| 2017 | Q2 | 99.8 | 100.1 | 99.6 |
| 2017 | Q3 | 100.4 | 100.4 | 98.9 |
| 2017 | Q4 | 100.4 | 100.5 | 102.1 |
| 2018 | Q1 | 103.3 | 101.0 | 102.3 |
| 2018 | Q2 | 102.8 | 101.4 | 102.8 |
| 2018 | Q3 | 103.9 | 101.5 | 103.3 |
| 2018 | Q4 | 103.8 | 101.6 | 102.2 |
| 2019 | Q1 | 104 | 101.8 | 102.9 |
| 2019 | Q2 | 103.9 | 101.8 | 103.2 |
| 2019 | Q3 | 105.1 | 102.2 | 103.6 |
| 2019 | Q4 | 106.1 | 102.6 | 103.0 |
| 2020 | Q1 | 105.0 | 103.0 | 103.3 |
| 2020 | Q2 | 102.9 | 100.9 | 102.4 |
| 2020 | Q3 | 100.1 | 98.8 | 101.9 |
| 2020 | Q4 | 100.6 | 99.3 | 102.2 |
| 2021 | Q1 | 101.6 | 98.7 | 102.0 |
| 2021 | Q2 | 103.3 | 99.6 | 103.5 |
| 2021 | Q3 | 104.4 | 101.2 | 105.2 |
| 2021 | Q4 | 106.3 | 102.0 | 106.2 |
| 2022 | Q1 | 111.0 | 103.6 | 108.8 |
| 2022 | Q2 | 112.9 | 107.3 | 111.9 |
| 2022 | Q | 117.2 | 110.3 | 115.5 |
| 2022 | Q4 | 115.0 | 111.3 | 116.5 |
| 2023 | Q1 | 116.0 | 111.8 | 116.5 |
| 2023 | Q2 | 118.2 | 110.9 | 117.7 |
| 2023 | Q3 | 119.4 | 110.3 | 118.7 |
| 2023 | Q4 | 119.7 | 110.2 | 117.9 |
| 2024 | Q1 | 119.9 | 111.4 | 118.7 |
| 2024 | Q2 | 121.2 | 113.6 | 120.1 |
| 2024 | Q3 | 122.5 | 113.8 | 120.9 |
| 2024 | Q4 | 121.8 | 114.0 | 121.8 |
| 2025 | Q1 | 127.0 | 113.8 | 124.3 |
| 2025 | Q2 | 127.6 | 114.8 | 125.2 |
| 2025 | Q3 | 126.6 | 116.0 | 125.1 |
| 2025 | Q4 | 125.3 | 116.5 | 125.3 |
| 2026 | Q1 | 129.6 | 119.0 | 128.6 |
| 2026 | Q2 | 131.8 | 120.8 | 131.5 |
| 2026 | Q3 | 134.0 | 121.1 | 131.6 |
| * provisional figures | ||||
Provisional figures
Figures referring to Q3 2026 are provisional and will be definitive upon publication of the figures over Q4 2026.
Papiamentu
A Papiamentu translation of this news release can be found here.
Sources
Related items
- Time series - Consumer prices European Netherlands