Greenhouse gas emissions up slightly in the second quarter of 2026
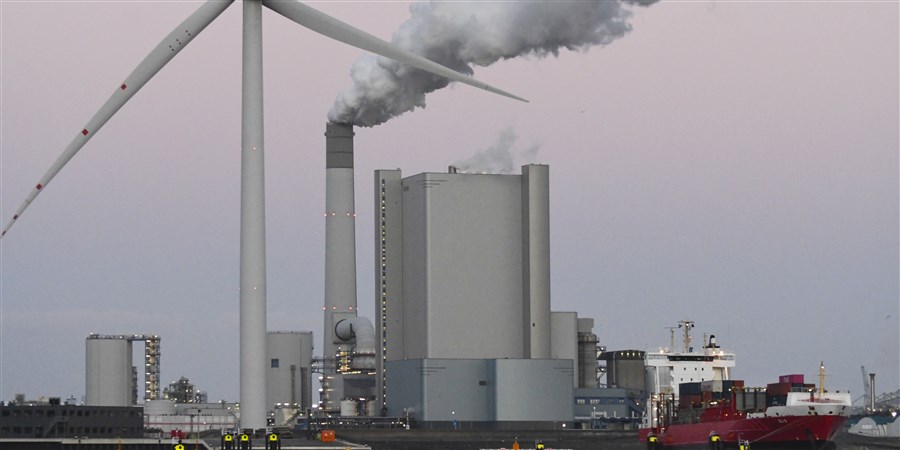
Greenhouse gas (GHG) emissions were slightly higher in Q2 2026 than in Q2 2025 (+0.6 precent). Lower emissions in the mobility sector were offset by higher emissions in the electricity sector. Statistics Netherlands (CBS) and the National Institute for Public Health and the Environment (RIVM)/Emissions Register report this on the basis of provisional quarterly figures on GHG emissions, in accordance with the IPCC guidelines.
| CO2 (megatonnes of CO2-equivalent) | Other greenhouse gases (megatonnes of CO2-equivalent) | ||
|---|---|---|---|
| Total IPCC | 2026 | 25.5 | 6.1 |
| Total IPCC | 2025 | 25.2 | 6.2 |
| Manufacturing | 2026 | 9.6 | 1.2 |
| Manufacturing | 2025 | 9.6 | 1.2 |
| Mobility | 2026 | 6.5 | 0.2 |
| Mobility | 2025 | 7.2 | 0.2 |
| Agriculture | 2026 | 1.2 | 4.5 |
| Agriculture | 2025 | 1.2 | 4.6 |
| Electricity | 2026 | 5.5 | 0 |
| Electricity | 2025 | 4.5 | 0 |
| Buildings and construction | 2026 | 2 | 0.1 |
| Buildings and construction | 2025 | 1.9 | 0.1 |
| Land use | 2026 | 0.7 | 0.2 |
| Land use | 2025 | 0.7 | 0.2 |
| * provisional figures | |||
Lower emissions from the mobility sector
In Q2 2026, the mobility sector emitted over 10 percent less greenhouse gas, year on year. Diesel consumption was lower, in particular. This was due to a fuel tax discount in Germany intended to offset rising diesel prices. As a result, it was more cost-effective for international freight transporters to refuel across the border in Germany. Under IPCC guidelines, the resulting emissions are attributed to Germany. In addition, there has been a further increase in the use of electric vehicles in the Netherlands.
In the second quarter of 2026, the mobility sector’s contribution to total emissions was 21 percent, down from 23.5 percent in Q2 2025.
Higher emissions in the electricity sector
In Q2 2026, the electricity sector emitted nearly 22 percent more greenhouse gases than in the same quarter of 2025. Higher electricity production required increased consumption of coal (+87 percent) and natural gas (+15 percent). More electricity was exported, in particular to Belgium, and domestic consumption was also higher. The electricity sector’s contribution to total emissions was 17.5 percent in Q2 2026, compared to 14.5 percent Q2 2025.
Emissions from manufacturing down
Emissions from the manufacturing sector were slightly lower than in the same quarter of the previous year (-1 percent). Emissions from the petroleum industry was higher. However, the chemical industry emitted less, partly due to maintenance at several energy-intensive companies. The manufacturing sector accounted for the largest share of total emissions in the second quarter of 2026, at 34 percent.
| Sector | Share |
|---|---|
| Manufacturing | 34 |
| Mobility | 20.9 |
| Agriculture | 18 |
| Electricity | 17.5 |
| Buildings and construction | 6.6 |
| Land use | 2.9 |
CBS also calculates CO2 emissions from all domestic economic activities according to the methods of the national accounts. Unlike emissions calculated according to the IPCC definitions, these include CO2 emissions from international air and sea transport and emissions from the combustion of biomass. In this news release, CO2 emissions are described in accordance with the calculation method and terminology set out in the national accounts.
CO2 emissions from the Dutch economy 2.5 percent higher
The Dutch economy emitted 2.5 percent more CO2 in Q2 2026 than it did in Q2 2025, while gross domestic product (GDP) increased by 1.3 percent over the same period. Q2 2026 was colder overall than Q2 2025. After adjusting for the weather conditions, CO2 emissions increased by 1.4 percent.
The increase in CO2 emissions calculated according to the national accounts is greater than the increase in greenhouse gas emissions according to the IPCC because the national accounts also include emissions from biomass combustion and international aviation. These emissions were higher, but they are excluded from the IPCC calculation.
The increased use of coal and biomass by power stations was a major contributor to the increase in emissions. As a result, energy and water companies, and waste management emitted nearly 19 percent more CO2. The value added by this sector remained virtually unchanged, however. In mining, manufacturing, and construction, both CO2 emissions and value added were 1 percent lower.
The transport sector, which comprises aviation, maritime shipping, inland shipping, and commercial road transport, emitted just over 1 percent less CO2, despite an increase in aviation emissions. The sector's value added grew by more than 3 percent.
Households and the services sector also emitted less CO2, primarily due to lower petrol and diesel consumption. The services sector, however, saw an increase in value added.
| Category | CO2-emissions (year-on-year volume change in %) | Value added (year-on-year volume change in %) | GDP (year-on-year volume change in %) |
|---|---|---|---|
| Total (weather adjusted) | 1.4 | ||
| Total | 2.5 | 1.3 | |
| Energy and water supply, waste management | 18.7 | -0.1 | |
| Agriculture, mining, manufacturing and construction | -1.2 | -1 | |
| Transport sector | -1.3 | 3.4 | |
| Households | -3 | ||
| Other services | -8.1 | 2 | |