Inflation in the Caribbean Netherlands up again in Q2 2026
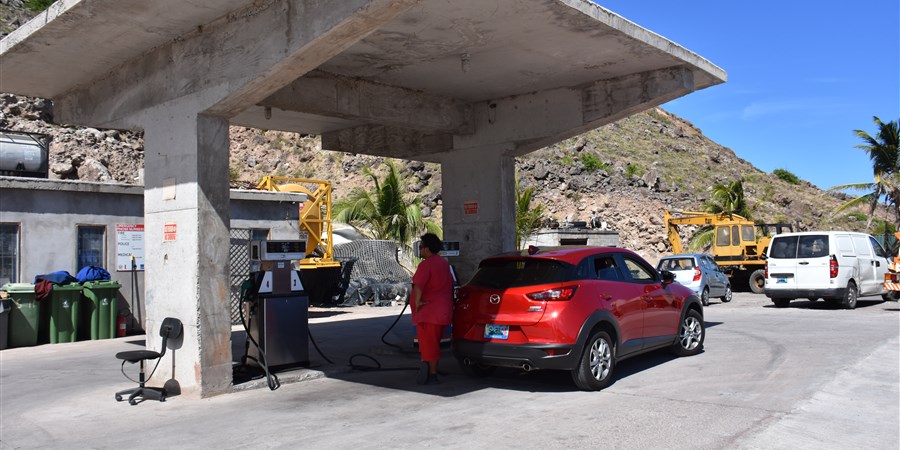
- Prices on Bonaire in Q2 were 3.3 percent higher year on year, and 1.8 percent higher quarter on quarter.
- Prices on St Eustatius in Q2 were 5.2 percent higher year on year, and 1.5 percent higher quarter on quarter.
- Prices on Saba in Q2 were 5.0 percent higher year on year, and 2.3 percent higher quarter on quarter.
Prices for consumer goods and services on Bonaire were 3.3 percent higher in Q2 2026 than they were in Q2 2025. Inflation in Q1 2026 was 2.0 percent. Statistics Netherlands (CBS) reports this on the basis of the consumer price index for the Caribbean Netherlands.
On St Eustatius, prices were up by 5.2 percent year on year in Q2 2026, compared to 4.6 percent in Q1. On Saba, inflation was 5.0 percent in Q2, compared to 3.4 percent in Q1.
| Jaar | Kwartaal | Bonaire (% year-on-year change in CPI) | St Eustatius (% year-on-year change in CPI) | Saba (% year-on-year change in CPI) |
|---|---|---|---|---|
| 2015 | Q1 | -0.6 | -1.1 | 1.5 |
| 2015 | Q2 | -0.9 | -1.7 | 0.9 |
| 2015 | Q3 | -0.9 | -0.5 | -0.4 |
| 2015 | Q4 | -1.2 | -0.7 | -0.1 |
| 2016 | Q1 | 0.5 | 0.4 | 0.3 |
| 2016 | Q2 | 0.4 | -0.1 | 0.0 |
| 2016 | Q3 | 0.6 | -0.9 | 0.2 |
| 2016 | Q4 | 0.5 | 0.2 | -0.3 |
| 2017 | Q1 | 0.1 | 1.1 | -1.0 |
| 2017 | Q2 | 0.4 | 2.6 | -1.0 |
| 2017 | Q3 | 0.6 | 2.1 | -1.3 |
| 2017 | Q4 | 1.2 | 1.8 | 2.5 |
| 2018 | Q1 | 3.9 | 2.0 | 2.9 |
| 2018 | Q2 | 3.0 | 1.2 | 3.2 |
| 2018 | Q3 | 3.5 | 1.1 | 4.4 |
| 2018 | Q4 | 3.4 | 1.1 | 0.0 |
| 2019 | Q1 | 0.7 | 0.7 | 0.6 |
| 2019 | Q2 | 1.1 | 0.4 | 0.5 |
| 2019 | Q3 | 1.2 | 0.7 | 0.3 |
| 2019 | Q4 | 2.2 | 1.0 | 0.8 |
| 2020 | Q1 | 1.0 | 1.2 | 0.4 |
| 2020 | Q2 | -1.0 | -0.8 | -0.8 |
| 2020 | Q3 | -4.8 | -3.3 | -1.6 |
| 2020 | Q4 | -5.2 | -3.2 | -0.8 |
| 2021 | Q1 | -3.2 | -4.1 | -1.3 |
| 2021 | Q2 | 0.3 | -1.2 | 1.0 |
| 2021 | Q3 | 4.3 | 2.4 | 3.2 |
| 2021 | Q4 | 5.7 | 2.7 | 4.0 |
| 2022 | Q1 | 9.2 | 4.9 | 6.7 |
| 2022 | Q2 | 9.4 | 7.7 | 8.2 |
| 2022 | Q3 | 12.2 | 9.0 | 9.7 |
| 2022 | Q4 | 8.1 | 9.1 | 9.7 |
| 2023 | Q1 | 4.5 | 8.0 | 7.0 |
| 2023 | Q2 | 4.6 | 3.3 | 5.2 |
| 2023 | Q3 | 1.9 | 0.0 | 2.8 |
| 2023 | Q4 | 4.1 | -1.0 | 1.2 |
| 2024 | Q1 | 3.4 | -0.4 | 1.9 |
| 2024 | Q2 | 2.5 | 2.5 | 2.0 |
| 2024 | Q3 | 2.5 | 3.2 | 1.9 |
| 2024 | Q4 | 1.8 | 3.4 | 3.3 |
| 2025 | Q1 | 5.9 | 2.2 | 4.8 |
| 2025 | Q2 | 5.3 | 1.1 | 4.2 |
| 2025 | Q3 | 3.3 | 1.9 | 3.5 |
| 2025 | Q4 | 2.8 | 2.2 | 2.9 |
| 2026 | Q1 | 2.0 | 4.6 | 3.4 |
| 2026 | Q2 | 3.3 | 5.2 | 5.0 |
| * provisional figures | ||||
Prices on Bonaire up by 1.8 percent compared to Q1
Prices on Bonaire were up by 1.8 percent on average in Q2 2026 compared with Q1. This was mainly due to a rise in prices for transport of 5.6 percent. The price of petrol was up by 11.7 percent, while air travel was up by 7.5 percent.
Fresh vegetables were also more expensive in Q2, up by 5.2 percent. Prices in the accommodation and food services sector were 3.2 percent higher than in Q1.
Prices on St Eustatius up by 1.5 percent compared to Q1
On St Eustatius, prices were up by 1.5 percent in Q2 2026 compared with Q1 2026. As on Bonaire, this rise was mainly due to higher transport costs. The price of petrol was up by 7.2 percent and air travel was up by 10.5 percent.
Fresh vegetables also became more expensive, as they did on Bonaire.
Prices on Saba up by 2.3 percent compared to Q1
On Saba, consumer prices were 2.3 percent higher on average in Q2 compared with Q1. On Saba, as on the other islands, this rise in prices was mainly due to higher transport prices. Petrol was 20.9 percent more expensive than in the previous quarter, and air fares were 9 percent higher.
Food products and non-alcoholic beverages were 2.9 percent more expensive. This was largely because fresh vegetables, frozen meals and coffee have become more expensive.
| Jaar | Kwartaal | Bonaire (2017 = 100) | St Eustatius (2017 = 100) | Saba (2017 = 100) |
|---|---|---|---|---|
| 2015 | Q1 | 98.8 | 97.6 | 100.1 |
| 2015 | Q2 | 98.9 | 97.7 | 100.6 |
| 2015 | Q3 | 99.1 | 99.2 | 100.0 |
| 2015 | Q4 | 98.8 | 98.4 | 100.1 |
| 2016 | Q1 | 99.4 | 98.0 | 100.4 |
| 2016 | Q2 | 99.3 | 97.6 | 100.6 |
| 2016 | Q3 | 99.7 | 98.3 | 100.2 |
| 2016 | Q4 | 99.3 | 98.7 | 99.8 |
| 2017 | Q1 | 99.5 | 99.0 | 99.4 |
| 2017 | Q2 | 99.8 | 100.1 | 99.6 |
| 2017 | Q3 | 100.4 | 100.4 | 98.9 |
| 2017 | Q4 | 100.4 | 100.5 | 102.1 |
| 2018 | Q1 | 103.3 | 101.0 | 102.3 |
| 2018 | Q2 | 102.8 | 101.4 | 102.8 |
| 2018 | Q3 | 103.9 | 101.5 | 103.3 |
| 2018 | Q4 | 103.8 | 101.6 | 102.2 |
| 2019 | Q1 | 104.0 | 101.8 | 102.9 |
| 2019 | Q2 | 103.9 | 101.8 | 103.2 |
| 2019 | Q3 | 105.1 | 102.2 | 103.6 |
| 2019 | Q4 | 106.1 | 102.6 | 103.0 |
| 2020 | Q1 | 105.0 | 103.0 | 103.3 |
| 2020 | Q2 | 102.9 | 100.9 | 102.4 |
| 2020 | Q3 | 100.1 | 98.8 | 101.9 |
| 2020 | Q4 | 100.6 | 99.3 | 102.2 |
| 2021 | Q1 | 101.6 | 98.7 | 102.0 |
| 2021 | Q2 | 103.3 | 99.6 | 103.5 |
| 2021 | Q3 | 104.4 | 101.2 | 105.2 |
| 2021 | Q4 | 106.3 | 102.0 | 106.2 |
| 2022 | Q1 | 111.0 | 103.6 | 108.8 |
| 2022 | Q2 | 112.9 | 107.3 | 111.9 |
| 2022 | Q3 | 117.2 | 110.3 | 115.5 |
| 2022 | Q4 | 115.0 | 111.3 | 116.5 |
| 2023 | Q1 | 116.0 | 111.8 | 116.5 |
| 2023 | Q2 | 118.2 | 110.9 | 117.7 |
| 2023 | Q3 | 119.4 | 110.3 | 118.7 |
| 2023 | Q4 | 119.7 | 110.2 | 117.9 |
| 2024 | Q1 | 119.9 | 111.4 | 118.7 |
| 2024 | Q2 | 121.2 | 113.6 | 120.1 |
| 2024 | Q3 | 122.5 | 113.8 | 120.9 |
| 2024 | Q4 | 121.8 | 114.0 | 121.8 |
| 2025 | Q1 | 127.0 | 113.8 | 124.3 |
| 2025 | Q2 | 127.6 | 114.8 | 125.2 |
| 2025 | Q3 | 126.6 | 116.0 | 125.1 |
| 2025 | Q4 | 125.3 | 116.5 | 125.3 |
| 2026 | Q1 | 129.6 | 119.0 | 128.6 |
| 2026 | Q2 | 131.8 | 120.8 | 131.5 |
| * provisional figures | ||||
Provisional figures
The figures for Q2 2026 are provisional and will only be made definitive upon publication of the figures for the next quarter, Q3 2026. The provisional figures for Q1 2026 for St Eustatius have been adjusted on the basis of new data. This concerns the product group: housing, water and energy.
Papiamentu
A Papiamentu translation of this news release can be obtained from the office of Statistics Netherlands on Bonaire by sending a request by email to: caribischnederland@cbs.nl.