Increase in greenhouse gas emissions in 2025
Greenhouse gas (GHG) emissions were 0.8 percent higher in 2025 than in 2024. This is mainly because emissions from the electricity sector were 22 percent higher. However, the manufacturing and mobility sectors emitted over 4 percent less greenhouse gases in 2025 than they did in 2024. Statistics Netherlands (CBS) and the National Institute for Public Health and the Environment (RIVM)/Emissions Register report this on the basis of provisional quarterly figures on GHG emissions, in accordance with the IPCC guidelines.
Last year, GHG emissions fell to 36 percent below the 1990 level. The Dutch Climate Act sets an emissions target of 55 percent below the 1990 level by 2030. This amounts to a reduction of 125 megatonnes of CO2 equivalent. Between 1990 and 2024, emissions fell by an average of 2.4 megatonnes each year. In 2024, emissions were 1.2 megatons higher than in 2024. To achieve the target of the climate law, emissions must fall by an average of 8.7 megatonnes each year over the next five years.
| Manufacturing (Megatonnes CO2-equivalent) | Electricity (Megatonnes CO2-equivalent) | Mobility (Megatonnes CO2-equivalent) | Agriculture (Megatonnes CO2-equivalent) | Buildings and construction (Megatonnes CO2-equivalent) | Land use (Megatonnes CO2-equivalent) | Goal 2030 (Megatonnes CO2-equivalent) | |
|---|---|---|---|---|---|---|---|
| 1990 | 86.975 | 39.607 | 33.17 | 33.2 | 29.827 | 3.839 | |
| 1991 | 88.293 | 40.091 | 33.619 | 34.596 | 34.077 | 3.815 | |
| 1992 | 89.531 | 40.633 | 35.069 | 34.386 | 31.41 | 3.866 | |
| 1993 | 85.834 | 41.896 | 35.899 | 34.418 | 33.24 | 3.7 | |
| 1994 | 86.73 | 45.736 | 35.448 | 32.933 | 31.067 | 4.054 | |
| 1995 | 81.989 | 47.8 | 36.079 | 32.92 | 33.146 | 3.713 | |
| 1996 | 84.551 | 48.287 | 37.376 | 33.515 | 38.548 | 3.543 | |
| 1997 | 84.172 | 48.474 | 37.209 | 31.253 | 32.721 | 3.11 | |
| 1998 | 84.157 | 50.238 | 37.924 | 30.426 | 31.284 | 3.539 | |
| 1999 | 76.223 | 47.186 | 38.789 | 29.629 | 29.66 | 3.294 | |
| 2000 | 74.577 | 48.363 | 38.675 | 28.597 | 29.648 | 3.438 | |
| 2001 | 70.603 | 51.92 | 38.949 | 28.027 | 31.441 | 4.241 | |
| 2002 | 69.784 | 52.955 | 39.391 | 26.297 | 30.239 | 4.528 | |
| 2003 | 68.554 | 53.682 | 39.788 | 25.983 | 31.388 | 3.818 | |
| 2004 | 68.641 | 54.889 | 40.241 | 25.989 | 31.114 | 3.838 | |
| 2005 | 66.816 | 52.085 | 40.67 | 26.209 | 29.353 | 3.593 | |
| 2006 | 65.343 | 47.843 | 41.542 | 25.843 | 29.467 | 3.406 | |
| 2007 | 64.634 | 50.608 | 40.556 | 26.513 | 26.352 | 3.753 | |
| 2008 | 60.685 | 49.964 | 40.809 | 27.687 | 29.413 | 3.928 | |
| 2009 | 56.724 | 49.887 | 39.257 | 27.664 | 29.455 | 3.868 | |
| 2010 | 59.612 | 51.984 | 40.047 | 29.313 | 34.045 | 4.038 | |
| 2011 | 58.419 | 47.788 | 40.086 | 27.841 | 26.7 | 4.24 | |
| 2012 | 57.105 | 44.793 | 38.225 | 27.548 | 28.897 | 3.872 | |
| 2013 | 56.61 | 44.89 | 36.772 | 27.815 | 30.113 | 3.585 | |
| 2014 | 55.422 | 48.563 | 34.401 | 26.615 | 22.979 | 4.405 | |
| 2015 | 55.319 | 53.126 | 34.087 | 27.674 | 24.524 | 4.538 | |
| 2016 | 56.033 | 51.979 | 34.193 | 27.841 | 25.222 | 4.199 | |
| 2017 | 56.884 | 48.274 | 34.7 | 28.042 | 24.68 | 3.529 | |
| 2018 | 55.835 | 44.573 | 34.916 | 27.756 | 24.341 | 3.307 | |
| 2019 | 54.996 | 41.544 | 34.302 | 27.554 | 23.241 | 3.071 | |
| 2020 | 53.704 | 32.53 | 29.942 | 27.146 | 21.734 | 2.763 | |
| 2021 | 53.925 | 32.418 | 29.854 | 27.12 | 24.395 | 3.125 | |
| 2022 | 49.455 | 30.506 | 29.652 | 24.473 | 18.96 | 2.882 | |
| 2023 | 46.409 | 23.591 | 30.728 | 24.97 | 17.107 | 3.288 | |
| 2024 | 47.131 | 22.96 | 29.204 | 24.992 | 16.407 | 3.701 | |
| 2025 | 44.987 | 28.016 | 27.981 | 24.957 | 16.382 | 3.239 | |
| 2026 | |||||||
| 2027 | |||||||
| 2028 | |||||||
| 2029 | 102 | ||||||
| 2030 | 102 | ||||||
| 2031 | 102 | ||||||
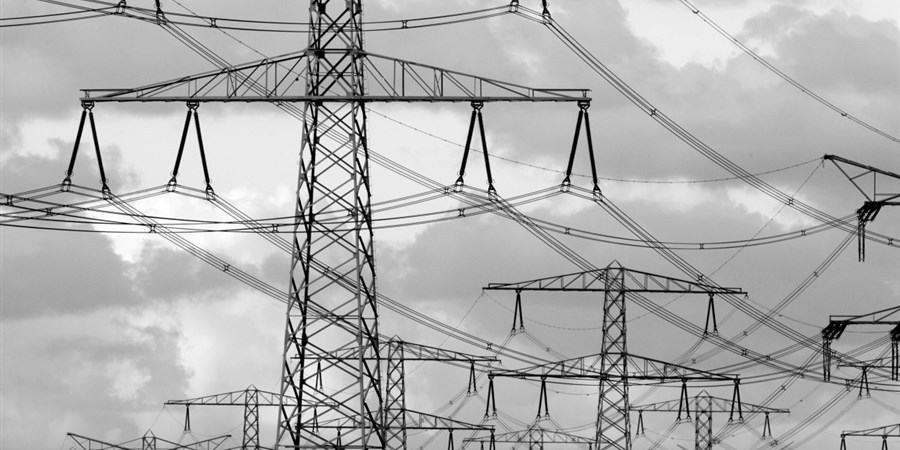
More emissions of greenhouse gases from the electricity sector
In 2025, GHG emissions from the electricity sector were 22 percent higher, year on year. Electricity production was higher. This was due to increased demand from abroad, particularly from Germany and Belgium. The increase in Dutch electricity production from renewable sources was not sufficient to meet this demand, which meant that more electricity was produced from coal (+25 percent) and natural gas (+11 percent). In order to achieve the sector's indicative residual emission target, emissions from the electricity sector would have to be halved between 2025 and 2030.
Lower greenhouse gas emissions from manufacturing
Greenhouse gas emissions from the manufacturing sector were 4.5 percent lower than in 2024. This is linked to lower consumption of natural gas and oil residue gas, particularly in the chemical industry. A one-third reduction in industrial emissions is needed to achieve the indicative sector target for 2030.
Emissions from mobility also lower
The mobility sector emitted 4 percent less greenhouse gases in 2025 than in 2024. This is partly due to the increase in electric passenger cars and a decrease in petrol and diesel cars. The indicative sector target for 2030 requires a further decrease of a quarter.
| CO2 (megatonnes of CO2-equivalent) | Other greenhouse gases (megatonnes of CO2-equivalent) | Goal 2030 (megatonnes of CO2-equivalent) | ||
|---|---|---|---|---|
| Manufacturing | 2030 | 28.8 | ||
| Manufacturing | 2025 | 39.977 | 5.01 | |
| Manufacturing | 2024 | 42.023 | 5.107 | |
| Electricity | 2030 | 13 | ||
| Electricity | 2025 | 27.858 | 0.158 | |
| Electricity | 2024 | 22.81 | 0.151 | |
| Mobility | 2030 | 21.3 | ||
| Mobility | 2025 | 27.343 | 0.638 | |
| Mobility | 2024 | 28.567 | 0.638 | |
| Agriculture | 2030 | 17.9 | ||
| Agriculture | 2025 | 6.282 | 18.674 | |
| Agriculture | 2024 | 6.209 | 18.783 | |
| Buildings and construction | 2030 | 13.2 | ||
| Buildings and construction | 2025 | 15.932 | 0.45 | |
| Buildings and construction | 2024 | 15.956 | 0.451 | |
| Land use | 2030 | 1.8 | ||
| Land use | 2025 | 2.51 | 0.728 | |
| Land use | 2024 | 2.978 | 0.723 |
CBS also calculates CO2 emissions from all domestic economic activities according to the national accounts. Unlike emissions as defined by the IPCC, this also includes CO2 emissions from international air and sea transport and emissions from biomass combustion, but not emissions from land use. In the section below, CO2 emissions are presented in accordance with the calculation method set out in the national accounts.
More CO2 emissions from the Dutch economy in 2025
The Dutch economy emitted 0.8 percent more CO2 in 2025 than in 2024. Gross domestic product (GDP) grew by 1.9 percent in 2025. Taking the weather conditions into account, emissions remained virtually unchanged from 2024.
The increase in CO2 emissions was mainly due to higher usage of coal and natural gas by the electricity sector. As a result, the energy, water and waste management sector emitted almost 12 percent more CO2. Their value added (the difference between production and consumption of energy, materials and services) was nearly 3 percent higher.
In 2025, the transport sector emitted nearly 3 percent more CO2. This is due to higher fuel consumption in maritime shipping and aviation, sectors that are not included in the IPCC calculation for the Netherlands. The value added of the transport sector was nearly 2 percent higher.
Emissions were lower in other sectors. The decrease in the mining and quarrying, manufacturing and construction sectors was mainly due to lower natural gas consumption in the chemical and petroleum industries. Emissions also fell among households and the other services sector. This was mainly attributable to lower diesel consumption, partly due to a decrease in the number of diesel cars. This decline coincided with an increase in the value added of the agriculture, mining and quarrying, manufacturing and construction, and the services sectors.
| Category | CO2-emissions (year-on-year volume change in %) | Value added (year-on-year volume change in %) | GDP (year-on-year volume change in %) |
|---|---|---|---|
| Total (weather adjusted) | -0.1 | ||
| Total | 0.8 | 1.9 | |
| Energy and water supply, waste management | 11.7 | 2.9 | |
| Transport sector | 2.9 | 1.6 | |
| Households | -1.6 | ||
| Agriculture, mining, manufacturing and construction | -5.1 | 2.1 | |
| Other services | -5.9 | 1.6 | |
Decline in CO2 emission intensity of Dutch economy virtually stable after 2023
Between 2015 and 2023, the CO2 intensity of the Dutch economy decreased by 32 percent. After 2023, emission intensity hardly decreased any further. In 2025, the CO2 emission intensity of the economy was 34 percent lower than in 2015.
| Year | CO2 intensity (kg CO2 per euro) |
|---|---|
| 2015 | 0.25 |
| 2016 | 0.25 |
| 2017 | 0.24 |
| 2018 | 0.23 |
| 2019 | 0.22 |
| 2020 | 0.21 |
| 2021 | 0.2 |
| 2022 | 0.18 |
| 2023 | 0.17 |
| 2024 | 0.17 |
| 2025 | 0.17 |