Greenhouse gas emissions 6 percent lower in 2023
Last year, GHG emissions fell to 34 percent below the 1990 level. The Dutch Climate Act sets an emissions target of 55 percent lower than the 1990 level by 2030.
| Sector | Year | CO2 (megatonnes of CO2-equivalent) | Other greenhouse gases (megatonnes of CO2-equivalent) |
|---|---|---|---|
| Totaal IPCC | 2023* | 123.2 | 26.3 |
| Totaal IPCC | 2022 | 132.1 | 26.4 |
| Manufacturing | 2023* | 42.5 | 5.3 |
| Manufacturing | 2022 | 43.7 | 5.5 |
| Mobility | 2023* | 29.5 | 0.6 |
| Mobility | 2022 | 28.9 | 0.6 |
| Agriculture | 2023* | 6 | 19 |
| Agriculture | 2022 | 5.5 | 18.9 |
| Electricity | 2023* | 23.6 | 0.2 |
| Electricity | 2022 | 30.3 | 0.2 |
| Buildings and construction | 2023* | 17.3 | 0.5 |
| Buildings and construction | 2022 | 19.2 | 0.5 |
| Land use | 2023* | 4.4 | 0.7 |
| Land use | 2022 | 4.4 | 0.7 |
| * provisional figures | |||
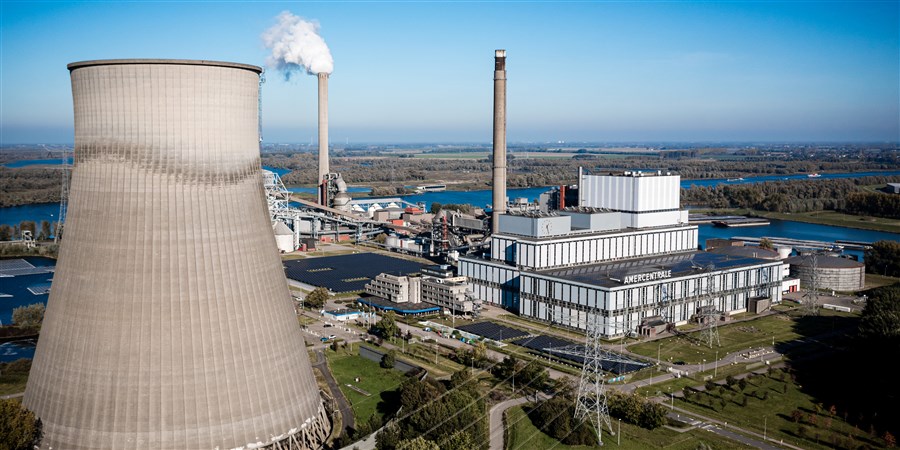
Emissions of greenhouse gases from the electricity sector are considerably lower
In 2023, GHG emissions from the electricity sector were 22 percent lower than in 2022. Because more electricity was generated with wind and solar energy, less electricity was produced with coal and natural gas. The significant drop in emissions means that the electricity sector’s share of total greenhouse gas emissions also fell from 19 percent in 2022 to 16 percent in 2023.
The built environment (homes, offices, schools, care institutions, etc.) emitted 10 percent fewer greenhouse gases in 2023 than one year previously. This was due to lower natural gas consumption. The winters of 2023 and 2022 were comparable in temperature, but the natural gas price for households was still relatively high, especially in the first half of 2023. The share of the built environment in greenhouse gas emissions was 12 percent last year.
Greenhouse gas emissions from manufacturing down slightly
Greenhouse gas emissions from manufacturing were 3 percent lower than in 2022. Manufacturing used 21 percent less coal and 4 percent less natural gas, but more petroleum raw materials and products. Manufacturing still had the largest share of total greenhouse gas emissions, at 32 percent. The vast majority of those emissions were in the form of CO2.
Greenhouse gas emissions from agriculture slightly higher
In 2023, greenhouse gas emissions from agriculture were 2 percent higher. This was because greenhouse horticulture made more use of their combined heat and power installations (CHP) which run on natural gas. However, the majority of emissions from agriculture are methane and nitrous oxide from livestock and land. Emissions of these gases remained unchanged.
The mobility sector also emitted 2 percent more greenhouse gases, mainly because petrol consumption increased. Emissions from the mobility sector accounted for 20 percent of the total in 2023.
Small part of emissions from land use
A small fraction of GHG emissions, around 3 percent, is related to land use. This concerns, for example, CO2 emissions from the oxidation of peat soils and the emissions associated with changes in land use.
From 2023 on, emissions from land use will be included in total GHG emissions, since they count towards the current Netherlands’ goal of reducing GHG emissions by at least 55 percent by 2030. Land use is also included in the European Union’s climate targets.
| Categories | Column1 |
|---|---|
| Manufacturing | 32 |
| Mobility | 20.1 |
| Agriculture | 16.7 |
| Electricity | 15.9 |
| Buildings and construction | 11.9 |
| Land use | 3.4 |
CBS also calculates CO2 emissions from all domestic economic activities according to the national accounts. Unlike emissions as defined by the IPCC, this also includes CO2 emissions from international air and sea transport and emissions from biomass combustion. In the message below, the CO2 emissions are presented in accordance with the calculation method of the national accounts.
Fewer CO2 emissions by the Dutch economy
In 2023, the Dutch economy emitted 5.5 percent less CO2 than in 2022, while gross domestic product (GDP) remained virtually the same in 2023. Total emissions are also related to weather conditions. Taking this into account, the decrease in CO2 emissions amounted to 4.7 percent.
The decrease in CO2 emissions was mainly due to lower use of coal, biomass and natural gas by the electricity sector. In addition, emissions from households and other services were lower due to lower natural gas consumption. Households did consume more petrol, however.
In 2023, CO2 emissions from mineral extraction, manufacturing and construction combined were are also lower than one year previously. The chemical and basic metal industry emitted less CO2, while emissions from the petroleum industry were higher.
The transport sector, by contrast, emitted more CO2 than one year previously. This was mainly because aviation emitted over 9 percent more than in 2022. Emissions from Inland shipping were also higher, although emissions from road and maritime transport were lower.
| Categories | CO2-emissions (year-on-year volume change in %) | Value added (year-on-year volume change in %) | GDP (year-on-year volume change in %) |
|---|---|---|---|
| Total (weather adjusted) | -4.7 | ||
| Total | -5.5 | 0.1 | |
| Agriculture | 6 | -2.1 | |
| Transport sector | 1.8 | -6.9 | |
| Households | -2.9 | ||
| Mining, manufacturing and construction | -3.1 | -2.6 | |
| Other services | -5.9 | 0.5 | |
| Energy and water supply, waste management | -15.3 | 3.6 | |
CO2 emission intensity in the Dutch economy has decreased further in 2023
Since 2015, the CO2 intensity of the Dutch economy has decreased steadily. This means that the CO2-efficiency of production processes continues to improve. The greenhouse gas intensity of the economy as a whole was over 30 percent lower in 2023 than it was in 2015.
| Year | CO2 intensity (kg CO2 per euro) |
|---|---|
| 2010 | 0.32 |
| 2011 | 0.3 |
| 2012 | 0.3 |
| 2013 | 0.3 |
| 2014 | 0.29 |
| 2015 | 0.29 |
| 2016 | 0.28 |
| 2017 | 0.27 |
| 2018 | 0.26 |
| 2019 | 0.25 |
| 2020 | 0.24 |
| 2021 | 0.23 |
| 2022 | 0.21 |
| 2023 | 0.2 |