More Dutch citizens in favour of nuclear energy
In 2020, 25 percent of Dutch people aged 18 and over believed the use of nuclear power should increase, 18 percent thought it should decrease, while 25 percent were completely against it. This year, support for more nuclear energy has risen to 36 percent, 12 percent say it should be reduced and 15 percent wants it banned. The overall public opinion about nuclear energy has therefore become more positive over the past three years.
| More (% of persons aged 18 and over) | Same (% of persons aged 18 and over) | Less (% of persons aged 18 and over) | Not at all (% of persons aged 18 and over) | No opinion (% of persons aged 18 and over) | Do not know this source (% of persons aged 18 and over) | |
|---|---|---|---|---|---|---|
| 2023 | 35.7 | 13.9 | 12.3 | 14.7 | 20.6 | 2.8 |
| 2020 | 25.0 | 12.4 | 17.8 | 25.4 | 16.4 | 2.9 |
More support among men and elderly people
Support is greater among men than among women: 49 versus 23 percent. It is higher among the elderly than in the younger age groups. In the 35 to 44 years age bracket, 30 percent are in favour of more nuclear energy, against over 40 percent in the group aged 75 and over. Support is also higher among people with completed higher vocational or university education.
| Categorie | More (% of persons aged 18 and over) | Same (% of persons aged 18 and over) | Less (% of persons aged 18 and over) | Not at all (% of persons aged 18 and over) | No opinion (% of persons aged 18 and over) | Do not know this source (% of persons aged 18 and over) |
|---|---|---|---|---|---|---|
| Total | 35.7 | 13.9 | 12.3 | 14.7 | 20.6 | 2.8 |
| Sex | ||||||
| Male | 49.1 | 15.3 | 10.4 | 12 | 11.7 | 1.6 |
| Female | 22.6 | 12.5 | 14.2 | 17.4 | 29.2 | 4.1 |
| Age | ||||||
| 18 to 24 yrs | 35.4 | 13.9 | 14.6 | 10.8 | 20.2 | 5.2 |
| 25 to 34 yrs | 34.4 | 10.6 | 13.4 | 13.6 | 24.1 | 3.9 |
| 35 to 44 yrs | 30.4 | 12.9 | 15 | 15.2 | 23.4 | 3.1 |
| 45 to 54 yrs | 34.2 | 13.5 | 13.4 | 15.3 | 21.8 | 1.9 |
| 55 to 64 yrs | 36.7 | 16.1 | 10 | 15.9 | 19.7 | 1.5 |
| 65 to 74 yrs | 38.3 | 16.5 | 10.5 | 17.3 | 15.7 | 1.7 |
| 75 yrs and over | 42.7 | 13.9 | 8.9 | 14.1 | 17.2 | 3.2 |
| Onderwijsniveau | ||||||
| Laag | 29.7 | 15 | 13.5 | 15.3 | 22 | 4.5 |
| Middelbaar | 36.3 | 14.2 | 13.1 | 14.2 | 19.9 | 2.4 |
| Hoog | 40.3 | 13.1 | 10.7 | 15.2 | 19.4 | 1.3 |
40 percent of the Zeeland population in favour
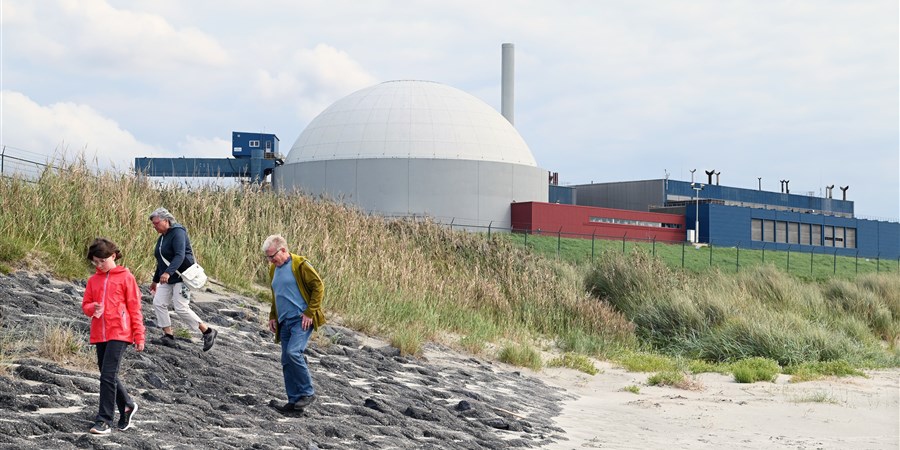
Residents of Zeeland, the only province with an operational nuclear plant (Borssele), are the most positive about nuclear energy: 40 percent of residents believe the Netherlands should make more use of it. The province with the lowest share of proponents is Groningen with 31 percent.
| More (% of persons aged 18 and over) | Same (% of persons aged 18 and over) | Less (% of persons aged 18 and over) | Not at all (% of persons aged 18 and over) | No opinion (% of persons aged 18 and over) | Do not know this source (% of persons aged 18 and over) | |
|---|---|---|---|---|---|---|
| Zeeland | 40.1 | 23.9 | 10.3 | 9.4 | 13.9 | 2.3 |
| Utrecht | 38.3 | 14.9 | 10.2 | 13.7 | 20.2 | 2.7 |
| Fryslân | 37.9 | 14.4 | 11.3 | 15.7 | 18.3 | 2.4 |
| Noord-Holland | 36.8 | 12.6 | 12.0 | 15.2 | 20.4 | 3.1 |
| Zuid-Holland | 36.4 | 14.5 | 11.5 | 13.5 | 21.2 | 3.0 |
| Overijssel | 36.3 | 13.6 | 13.4 | 14.3 | 19.8 | 2.6 |
| Gelderland | 35.2 | 13.1 | 12.3 | 15.6 | 20.6 | 3.3 |
| Limburg | 34.6 | 13.1 | 12.6 | 16.5 | 20.5 | 2.7 |
| Noord-Brabant | 34.2 | 13.3 | 14.0 | 15.0 | 21.2 | 2.2 |
| Flevoland | 32.2 | 12.8 | 14.6 | 12.3 | 24.7 | 3.4 |
| Drenthe | 31.5 | 14.6 | 15.2 | 14.7 | 21.1 | 2.9 |
| Groningen | 30.6 | 14.7 | 11.7 | 19.8 | 20.1 | 3.1 |
Support for more sustainable and less fossil-based energy
The majority of the Dutch population want to see less use of fossil fuels, or a complete ban. There should be more use of sustainable energy sources including wind energy, solar, geothermal energy and hydropower, according to most people. Solar energy has the largest support rate at 78 percent, followed by wind energy with 69 percent. The percentage shares are slightly lower than in 2020.
| Meer (% of persons aged 18 and over) | Evenveel als nu (% of persons aged 18 and over) | Minder (% of persons aged 18 and over) | Helemaal niet (% of persons aged 18 and over) | Weet ik niet (% of persons aged 18 and over) | Ik ken deze bron niet (% of persons aged 18 and over) | ||
|---|---|---|---|---|---|---|---|
| Solar | 2023 | 78.2 | 12.2 | 2.2 | 0.9 | 5.5 | 1.0 |
| Solar | 2020 | 83.0 | 9.0 | 1.3 | 1.0 | 5.0 | 0.7 |
| Wind | 2023 | 68.6 | 17.3 | 4.6 | 1.8 | 6.7 | 1.1 |
| Wind | 2020 | 72.5 | 14.4 | 4.9 | 1.7 | 5.7 | 0.9 |
| Hydropower | 2023 | 66.1 | 11.5 | 1.9 | 1.1 | 15.6 | 3.8 |
| Hydropower | 2020 | 67.9 | 10.5 | 1.4 | 1.3 | 14.6 | 4.3 |
| Geothermal heat | 2023 | 56.8 | 11.9 | 3.6 | 1.9 | 19.2 | 6.6 |
| Geothermal heat | 2020 | 56.3 | 10.8 | 4.0 | 2.6 | 17.7 | 8.5 |
| Nuclear | 2023 | 35.7 | 13.9 | 12.3 | 14.7 | 20.6 | 2.8 |
| Nuclear | 2020 | 25.0 | 12.4 | 17.8 | 25.4 | 16.4 | 2.9 |
| Biomass | 2023 | 23.3 | 15.3 | 14.5 | 11.3 | 27.4 | 8.1 |
| Biomass | 2020 | 23.0 | 15.1 | 15.1 | 13.4 | 24.6 | 8.7 |
| Natural gas | 2023 | 6.7 | 22.1 | 48.1 | 9.0 | 12.5 | 1.7 |
| Natural gas | 2020 | 6.5 | 24.8 | 48.4 | 8.6 | 10.5 | 1.1 |
| Oil | 2023 | 2.1 | 15.6 | 46.7 | 11.3 | 20.4 | 3.8 |
| Oil | 2020 | 1.3 | 15.7 | 48.4 | 13.1 | 18.3 | 3.2 |
| Coal | 2023 | 2.1 | 7.1 | 31.5 | 38.4 | 17.7 | 3.1 |
| Coal | 2020 | 1.3 | 6.3 | 32.5 | 43.7 | 14.1 | 2.2 |
The Perceptions Survey was conducted from 7 February to 21 April 2023 inclusive. The survey assessed the Dutch public opinion about climate change and the energy transition. Related issues also included in this survey were sustainable housing, sustainable mobility, sustainable food, and climate-conscious lifestyles. Over 18 thousand adults took part in the survey.