Greenhouse gas emissions 2.1 percent higher in 2021
| CO2 (megatonnes of CO2 equivalent) | Other greenhouse gases (megatonnes of CO2 equivalent) | ||
|---|---|---|---|
| Total IPCC | 2021* | 141.5 | 26.3 |
| Total IPCC | 2020* | 138.3 | 26.1 |
| Total IPCC | 2019 | 153.5 | 26.8 |
| Manufacturing | 2021* | 47 | 6.1 |
| Manufacturing | 2020* | 47.1 | 6 |
| Manufacturing | 2019 | 47.3 | 6.6 |
| Electricity | 2021* | 33 | 0.2 |
| Electricity | 2020* | 32.5 | 0.2 |
| Electricity | 2019 | 41.3 | 0.2 |
| Transport | 2021* | 30.1 | 0.7 |
| Transport | 2020* | 30 | 0.7 |
| Transport | 2019 | 34.4 | 0.7 |
| Agriculture | 2021* | 8 | 18.7 |
| Agriculture | 2020* | 7.5 | 18.7 |
| Agriculture | 2019 | 7.8 | 18.7 |
| Buildings and construction | 2021* | 23.4 | 0.5 |
| Buildings and construction | 2020* | 21.3 | 0.5 |
| Buildings and construction | 2019 | 22.6 | 0.5 |
| * provisional figures | |||
More natural gas consumption by buildings and construction
The increase in emissions was highest in the built environment (homes, offices, schools, care institutions, etc.). Compared to 2020, 10 percent more was emitted. This was mainly due to lower temperatures in the first half of 2021 compared to the same period in 2020, causing more natural gas consumption for heating. In the second half of the year, emissions in the built environment were at virtually the same level as in the previous year.
Also more emissions from the electricity sector and agriculture
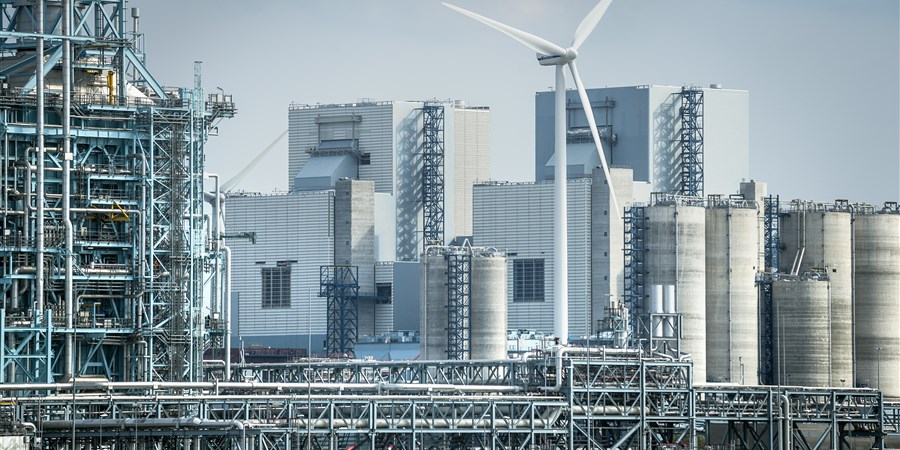
Last year, the electricity sector emitted 2 percent more greenhouse gases than in 2020. On the other hand, electricity production was 2 percent lower. The natural gas-fired power stations produced less, especially from Q2 2021 onwards, due to the increased natural gas price. The price of coal rose less sharply, so that relatively more electricity was produced from coal. More CO2 is released when using coal for electricity production than when using natural gas. As a result, emissions were still higher than one year previously.
The production of electricity from renewable sources grew in 2021. This reduced total emissions from the electricity sector slightly, but not enough to fully offset the higher CO2 emissions caused by the increased production from coal.
In agriculture, GHG emissions were also 2 percent higher than in 2020. Just as in the built environment, this was mainly due to the relatively cold and less sunny first half of the year. As a result, horticulturists used more natural gas to heat their greenhouses, for example. In the fourth quarter of 2021, however, natural gas consumption in agriculture was considerably lower than in the same quarter one year previously due to the high natural gas prices.
Emissions from manufacturing and transport virtually unchanged
Emissions from the transport sector in 2021 were about the same as in 2020. In 2020, emissions were significantly lower than one year previously. This decline did not continue in 2021. On average, road traffic intensity was more or less the same as in 2020.
In manufacturing as well, emissions remained virtually unchanged. In Q2 2021, emissions rose substantially due to higher manufacturing output than in the same quarter of the previous year. By contrast, emissions were significantly lower in Q4. Due to the higher natural gas prices in the second half of the year, less gas was purchased by industrial users.
| %-verandering (% change year-on-year) | ||
|---|---|---|
| Total IPCC | Quarter 1 | 1.9 |
| Total IPCC | Quarter 2 | 10.7 |
| Total IPCC | Quarter 3 | -3.4 |
| Total IPCC | Quarter 4 | 0.1 |
| Manufacturing | Quarter 1 | -0.8 |
| Manufacturing | Quarter 2 | 13 |
| Manufacturing | Quarter 3 | 0.8 |
| Manufacturing | Quarter 4 | -10.5 |
| Electricity | Quarter 1 | 7.5 |
| Electricity | Quarter 2 | 0.7 |
| Electricity | Quarter 3 | -14.3 |
| Electricity | Quarter 4 | 13.4 |
| Transport | Quarter 1 | -11.5 |
| Transport | Quarter 2 | 9.2 |
| Transport | Quarter 3 | -1.1 |
| Transport | Quarter 4 | 6.5 |
| Agriculture | Quarter 1 | 3.9 |
| Agriculture | Quarter 2 | 7.1 |
| Agriculture | Quarter 3 | 1.6 |
| Agriculture | Quarter 4 | -4.6 |
| Buildings and construction | Quarter 1 | 11.4 |
| Buildings and construction | Quarter 2 | 31.3 |
| Buildings and construction | Quarter 3 | -5.5 |
| Buildings and construction | Quarter 4 | 3 |
| * provisional figures | ||
Statistics Netherlands also calculates CO2 emissions from all domestic economic activities according to the Dutch national accounts. Unlike emissions according to the IPCC definitions, this also includes the CO2 emissions from international air and sea transport and the emissions from combustion of biomass. Below, the CO2 emissions are reported based on the calculation method of the national accounts.
CO2 emissions by the Dutch economy higher in 2021
In 2021, all Dutch economic activities, taking into account emissions from shipping, aviation and biomass emissions, emitted 3.1 percent more CO2 than in 2020. The increase was smaller than the increase in gross domestic product (GDP). The Dutch economy grew by 4.8 percent in 2021. Adjusted for the weather effect, the increase in CO2 emissions was 1.6 percent. Compared to 2019, CO2 emissions in 2021 were 6.1 percent lower.
The increase in emissions from the Dutch economy is largely due to the partial recovery of the transport sector (including aviation) in 2021. This sector emitted 7.3 percent more CO2 than in 2020, partly on account of aviation. In 2020, aviation was more affected by the lockdowns than in 2021. However, compared to 2019, emissions from aviation were still about half lower. Inland shipping also emitted more than in 2020. On the other hand, emissions from road transport and sea shipping were lower than one year previously.
| Categories | CO2 emissions (year-on-year volume change in %) | Value added (year-on-year volume change in %) | Bbp (year-on-year volume change in %) |
|---|---|---|---|
| Total (weather adjusted) | 1.6 | ||
| Total | 3.1 | 4.8 | |
| Energy and water supply, waste management | 3 | 6.8 | |
| Other services | 4.5 | 4.5 | |
| Households | 6.8 | ||
| Agriculture | 4.5 | 0.8 | |
| Mining, manufacturing and construction | -1.5 | 5.7 | |
| Transport sector | 7.3 | 12.8 | |
CO2 emission intensity in the Dutch economy has decreased
Since 2015, the CO2 intensity of the Dutch economy has decreased. This decline also continued in 2020 and 2021, despite the impact of coronavirus. It means that the CO2 efficiency of production processes continues to improve. The greenhouse gas intensity of the economy as a whole was one fifth lower in 2021 than in 2015.
| CO2 intensity (kg CO2 per euro) | |
|---|---|
| 2015 | 0.29 |
| 2016 | 0.28 |
| 2017 | 0.27 |
| 2018 | 0.26 |
| 2019 | 0.25 |
| 2020 | 0.24 |
| 2021 | 0.23 |
Notes on early annual estimate
This early/first annual estimate of greenhouse gas emissions results from the quarterly estimate developed in 2020 in accordance with the IPCC guidelines. This quarterly estimate has been developed to provide faster insight into the evolution of emissions and is based on information available on a quarterly basis. The figures presented here will change slightly based on more current statistical source information that will become available at a later date.
At the beginning of September, the emission figures for 2021 will be published, which are produced under the responsibility of the Emission Registration and which are used for international reports. The figures will then become more accurate, especially at sector level. The final adoption of the 2021 annual figures will take place in February 2023.
Sources
Related items
- Report - IPCC