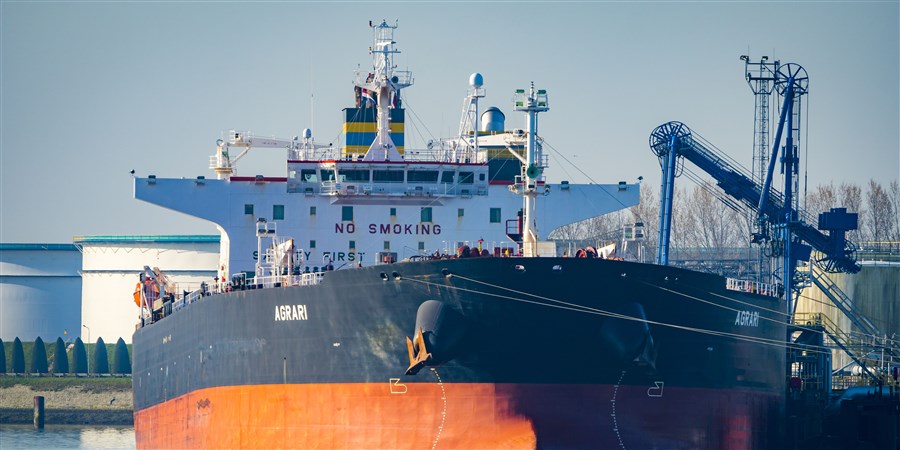
Goods imports down mainly due to less petroleum and gas
In 2019, before the outbreak of the coronavirus crisis, goods imports (460 billion euros) and goods exports (515 billion euros) reached record levels. More information on, for example, the international activities within the Dutch business economy, the composition and geographical dimension of Dutch trade and investments can be found in the publication Dutch Trade in Facts and Figures 2020, which is available in English as of today.
In the period from January to August 2019, mineral fuels accounted for 17 percent of total imports. This share shrank to approximately 11.5 percent in 2020. In addition to the coronavirus crisis, Dutch importers were faced with lower trade prices. During the first eight months of 2020, import prices were almost 4 percent down on the same period last year.
| Jaar | Mineral fuels (bn euros) | Other goods (bn euros) |
|---|---|---|
| 2012 | 64.5 | 194.0 |
| 2013 | 64.3 | 192.6 |
| 2014 | 59.2 | 194.6 |
| 2015 | 45.3 | 201.6 |
| 2016 | 34.1 | 204.7 |
| 2017 | 44.0 | 225.0 |
| 2018 | 52.3 | 237.9 |
| 2019 | 51.6 | 252.5 |
| 2020 | 32.0 | 243.0 |
Drop in imports mainly in April and May
In January and February, goods imports were more or less as high as in 2019. In April and May in particular, the value of imports fell due to lower demand for goods and lower trade prices. Imports were down by 21 and 23 percent respectively in these months relative to one year previously. As of June, goods imports picked up slightly but remained below the level of 2019.
| Maand | 2019 (bn euros) | 2020 (bn euros) |
|---|---|---|
| Jan | 38.6 | 39.0 |
| Feb | 36.0 | 35.8 |
| Mar | 39.6 | 37.4 |
| Apr | 39.1 | 30.9 |
| May | 39.7 | 30.6 |
| Jun | 37.0 | 35.2 |
| Jul | 38.3 | 34.5 |
| Aug | 35.8 | 32.1 |
Substantially less transport equipment imported
More than two-thirds of the decline in Dutch goods imports is due to lower imports of mineral fuels. In the first eight months of 2020, imports of crude oil (-7.7 billion euros), refined petroleum products (-7.3 billion euros) and natural gas (-2.9 billion euros) fell at an unprecedented rate. Imports of transport equipment and components contracted by 3.5 billion euros (-26 percent), mainly due to lower demand.
| Product | Imports (Year-on-year change, bn euros) |
|---|---|
| Crude oil | -7.722 |
| Refined petroleum products | -7.324 |
| Natural gas | -2.889 |
| Automotive parts and components | -1.472 |
| Passenger cars | -1.398 |
| Office equipment | -0.815 |
| Petroleum residues | -0.620 |
| Tractors, lorries, etc. | -0.430 |
Increase in imports of medical goods
The Netherlands imported a large number of medical goods and personal protective equipment from January to August 2020. The import value of medicines grew by 755 million euros (12 percent) to 6.9 billion euros. The import value of medical and non-medical face masks stood at 857 million euros, up by 678 million euros. The growth in imports of biodiesel is striking. Biodiesel is a mixture of mineral diesel and diesel produced from vegetable oil or animal fats. Dutch traders purchased 2.4 billion euros worth of biodiesel abroad, 475 million euros more than one year previously. Imports of raw materials for the production of biodiesel, such as oilseeds and animal and vegetable oils and fats, increased sharply as well in 2020.
| Product | Imports (Year-on-year change, bn euros) |
|---|---|
| Medicines | 0.755 |
| Face masks | 0.678 |
| Computers, laptops and tablets | 0.623 |
| Medicinal and pharmaceutical products | 0.597 |
| Oilseeds | 0.559 |
| Fruit | 0.511 |
| Animal and vegetable oils and fats | 0.485 |
| Biodiesel | 0.475 |
Significantly more face masks from China
Up to August, imports from China were up by 809 million euros. There was a sharp increase in imports of face masks (545 million euros) in particular. The demand for Chinese computers, laptops and tablets was also significantly higher in the first eight months of 2020 compared to last year. The four categories with the highest growth rate exclusively represent Asian goods.
| Imports (Year-on-year change, bn euros) | |
|---|---|
| China | 0.809 |
| Vietnam | 0.460 |
| Malaysia | 0.376 |
| Taiwan | 0.347 |
| Hungary | 0.246 |
Imports from Europe substantially lower
Goods imported from European countries fell by almost 23 billion euros. This is 12 percent below the level from January to August 2019. Among the suppliers of goods with the largest contraction are five European countries. In the case of Russia, the United Kingdom and Norway, this is largely due to reduced imports of mineral fuels.
| Mineral fuels (Year-on-year change, bn euros) | Other goods (Year-on-year change, bn euros) | |
|---|---|---|
| Russia | -5.156 | -0.156 |
| Germany | -0.801 | -3.356 |
| United Kingdom | -2.223 | -1.266 |
| Norway | -2.903 | -0.168 |
| Belgium | -1.103 | -1.671 |
Sources
- Publication - Dutch Trade in Facts and Figures 2020