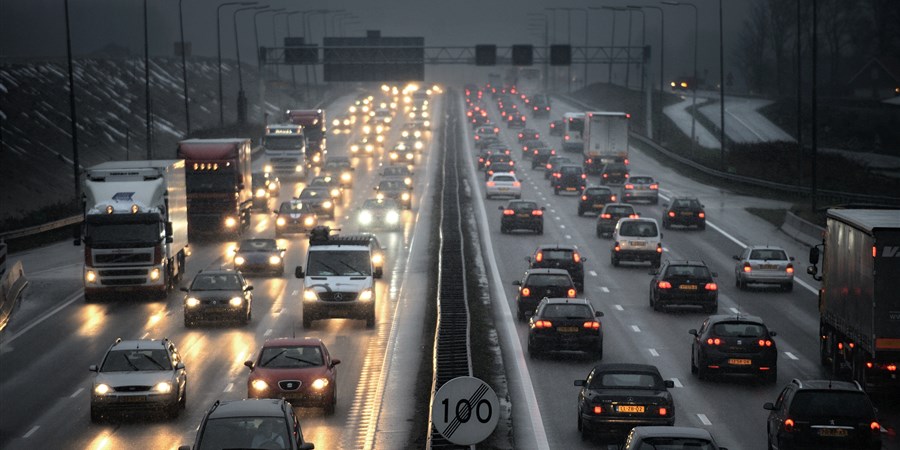
More vehicle traffic than ever in the Netherlands
[video: https://www.cbs.nlen-gb/video/06a65fe980e04fa5bb1cb185b9cf4e07]
(English subtitles available)
| Jaar | Passenger cars (year-on-year % change) | Mileage (year-on-year % change) |
|---|---|---|
| 2002 | 1.84 | 1.06 |
| 2003 | 1.01 | 0.88 |
| 2004 | 1.4 | 1.59 |
| 2005 | 0.42 | 0.79 |
| 2006 | 1.68 | 1.61 |
| 2007 | 2.2 | 2.09 |
| 2008 | 2 | 1.28 |
| 2009 | 0.66 | -0.15 |
| 2010 | 1.72 | -0.45 |
| 2011 | 2.61 | 1.91 |
| 2012 | 0.77 | -0.71 |
| 2013 | -0.42 | 0.09 |
| 2014 | 0.09 | 0.61 |
| 2015 | 1.04 | 1.22 |
| 2016 | 1.26 | 2.43 |
| 2017 | 2.03 | 0.35 |
| Source: CBS, RDW | ||
In 2017, the highest total vehicle mileage was clocked up by passenger cars, namely 119.1 billion kilometres. This represents an increase of 14.3 percent on 2002 and is slightly higher (0.4 percent) than in 2016. The increase is connected to the growing number of registered passenger cars: with a total of 9.1 million last year, this was 20.1 percent more than in 2002.
The increase in mileage did not keep pace with the growth of the total car fleet. On average, fewer kilometres were driven per car. The average annual mileage declined from 13.7 thousand in 2002 to 13 thousand in 2017.
Drivers of private vehicles in particular travelled a shorter distance last year (-6.2 percent), while the mileage driven by company cars dropped by 1 percent.
| Jaar | Delivery vans (bn km) |
|---|---|
| 2002 | 16.61 |
| 2003 | 17.01 |
| 2004 | 17.72 |
| 2005 | 17.91 |
| 2006 | 17.25 |
| 2007 | 17.57 |
| 2008 | 17.86 |
| 2009 | 17.41 |
| 2010 | 17.29 |
| 2011 | 17.06 |
| 2012 | 16.65 |
| 2013 | 16.31 |
| 2014 | 16.30 |
| 2015 | 16.54 |
| 2016 | 17.14 |
| 2017 | 17.74 |
| Source: CBS, RDW | |
Increased mileage of delivery vans for third year in a row
In 2017, Dutch delivery vans covered 17.7 billion kilometres in total. This is 6.8 percent more than in 2002 and 3.4 percent up on the previous year. The mileage has fluctuated since 2002. In 2006, for example, delivery vans ran up less mileage. This was related to lower sales of new delivery vans following abolition of tax benefits for private car owners with a ‘grey registration mark’ in mid-2005.
After 2008, the effects of the economic crisis became visible as total vehicle mileage declined. The lowest level of the past 15 years was reached in 2014, after which the total mileage of delivery vans increased again in each consecutive year.
In 2017, Dutch delivery vans drove fewer kilometres than before the crisis: 0.2 billion less than in 2008. There were 980 thousand delivery vans.
| Leeftijd | Delivery vans (% change relative to 2002) | Mileage (% change relative to 2002) |
|---|---|---|
| 0 yrs | -13.2 | -10.5 |
| 1 yr | -13.8 | -4.6 |
| 2 yrs | -35.7 | -30.5 |
| 3 yrs | -53.5 | -46.3 |
| 4 yrs | -49.2 | -40.4 |
| 5 yrs | -28.9 | -18.8 |
| 6 yrs | -5.6 | 9.9 |
| 7 yrs | 32 | 59.1 |
| 8 yrs | 80.3 | 127.8 |
| 9 yrs or older | 101.2 | 139.3 |
| Source: CBS, RDW | ||
More mileage by older vans
In 2002, 15 percent of delivery van kilometres was covered by vans of 9 years or older; this had gone up to nearly 34 percent in 2017. Compared to 15 years ago, the number of old delivery vans doubled to nearly 460 thousand. Sales of new vans were lower than in 2002 and older vans are on the road for a longer period nowadays.
| Jaartal | Heavy goods vehicles (bn km) | Buses (bn km) |
|---|---|---|
| 2002 | 10.58 | 0.72 |
| 2003 | 10.64 | 0.70 |
| 2004 | 10.70 | 0.68 |
| 2005 | 10.87 | 0.68 |
| 2006 | 11.04 | 0.67 |
| 2007 | 11.30 | 0.69 |
| 2008 | 11.29 | 0.71 |
| 2009 | 10.92 | 0.73 |
| 2010 | 10.57 | 0.73 |
| 2011 | 10.60 | 0.73 |
| 2012 | 10.28 | 0.71 |
| 2013 | 10.02 | 0.70 |
| 2014 | 9.90 | 0.67 |
| 2015 | 9.90 | 0.67 |
| 2016 | 10.03 | 0.66 |
| 2017 | 9.98 | 0.69 |
| Source: CBS, RDW | ||
Fewer kilometres by heavy goods vehicles
In contrast to passenger cars and delivery vans, heavy goods vehicles (HGVs) recorded lower mileage. Last year, the number of vehicle kilometres was 5.6 percent below the level of 2002. Average annual mileage of these vehicles fell from 48.5 thousand in 2002 to 44.2 thousand in 2017. In this period, the number of heavy goods vehicles dropped by 3.7 percent to 226 thousand.
HGV annual mileage peaked one year before the crisis in 2007, when 11.3 billion kilometres were covered. During the crisis, the HGV mileage went down almost every consecutive year. Between 2013 and 2017, it fluctuated around 10 billion annually.
Fewer kilometres covered by buses
Dutch bus mileage declined in 2017 as well, namely by 3.8 percent on 15 years previously. Buses recorded the highest mileage in 2010 at 735 million kilometres, dropping to 658 million in 2016. For the first time in six years, the mileage went up again last year: 691.6 million, 5.2 percent more than in 2016. The total bus fleet in the Netherlands included 11.3 thousand buses last year.