Higher peaks in hay fever medication turnover in 2018
This concerns over-the-counter medication in the form of tablets, nasal sprays or eye drops. Peaks in turnover are usually preceded by peaks in pollen counts in the air. This year, the allergenic pollen count reached its first peak in mid-April; a few weeks later than in 2017, but the measured concentrations were higher.
Likewise, sales of hay fever medication started to increase a few weeks later than in 2017 while the peak in turnover was also higher. The second turnover peak in 2018 followed the first one more shortly afterwards and was also higher than last year’s.
Highest peak during air presence of grass pollen
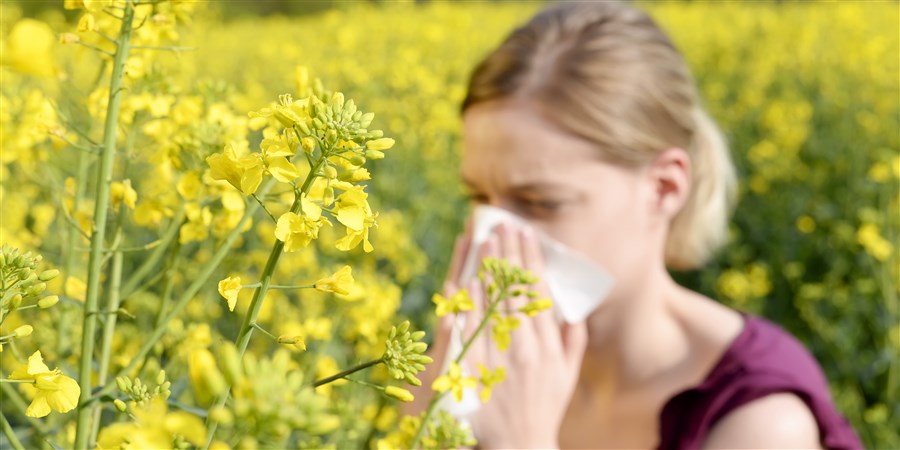
Every year, early spring - around the beginning of April – marks an increase in the sales of over-the-counter hay fever medication. This is also the period when pollen released by certain tree varieties such as birches trigger allergic reactions. Later on in the season at the end of May/beginning of June, when grass pollen are present in the air, the highest peak in sales is seen each year. This is likely due to the fact that many hay fever sufferers are affected by grass pollen. The time when the pollen concentration is highest is partly dependent on weather conditions.
| Turnover index medication (2016=100) | Most allergenic pollen per m3 of air | ||
|---|---|---|---|
| 2016 | 1 | 26.5 | 24 |
| 2016 | 2 | 23.4 | 3 |
| 2016 | 3 | 22.4 | 13 |
| 2016 | 4 | 24.3 | 107 |
| 2016 | 5 | 27.5 | 1013 |
| 2016 | 6 | 32.9 | 269 |
| 2016 | 7 | 30 | 263 |
| 2016 | 8 | 35.2 | 179 |
| 2016 | 9 | 34.9 | 133 |
| 2016 | 10 | 65.9 | 276 |
| 2016 | 11 | 95.3 | 303 |
| 2016 | 12 | 73.4 | 199 |
| 2016 | 13 | 92.4 | 42 |
| 2016 | 14 | 134.7 | 1177 |
| 2016 | 15 | 228.4 | 3475 |
| 2016 | 16 | 179.9 | 363 |
| 2016 | 17 | 108.6 | 282 |
| 2016 | 18 | 326.3 | 711 |
| 2016 | 19 | 373.3 | 231 |
| 2016 | 20 | 182.9 | 204 |
| 2016 | 21 | 259.7 | 85 |
| 2016 | 22 | 510.4 | 506 |
| 2016 | 23 | 561.1 | 563 |
| 2016 | 24 | 159.9 | 39 |
| 2016 | 25 | 142.1 | 167 |
| 2016 | 26 | 113 | 0 |
| 2016 | 27 | 135.2 | 510 |
| 2016 | 28 | 119.1 | 195 |
| 2016 | 29 | 123 | 181 |
| 2016 | 30 | 88.4 | 16 |
| 2016 | 31 | 68.7 | 68 |
| 2016 | 32 | 62.1 | 98 |
| 2016 | 33 | 67.7 | 82 |
| 2016 | 34 | 65.1 | 105 |
| 2016 | 35 | 57.2 | 73 |
| 2016 | 36 | 54.5 | 102 |
| 2016 | 37 | 53.3 | 44 |
| 2016 | 38 | 51.8 | 48 |
| 2016 | 39 | 44.7 | 71 |
| 2016 | 40 | 41.7 | 9 |
| 2016 | 41 | 33.7 | 9 |
| 2016 | 42 | 29.7 | 3 |
| 2016 | 43 | 28.1 | 1 |
| 2016 | 44 | 25.4 | 0 |
| 2016 | 45 | 22.5 | 1 |
| 2016 | 46 | 21.4 | 1 |
| 2016 | 47 | 23.6 | 1 |
| 2016 | 48 | 22.4 | 0 |
| 2016 | 49 | 20.7 | 0 |
| 2016 | 50 | 22.5 | 0 |
| 2016 | 51 | 27.2 | 0 |
| 2016 | 52 | 26.6 | 6 |
| 2017 | 1 | 24.9 | 6 |
| 2017 | 2 | 22.5 | 21 |
| 2017 | 3 | 22.1 | 7 |
| 2017 | 4 | 24.9 | 10 |
| 2017 | 5 | 25.9 | 18 |
| 2017 | 6 | 23 | 3 |
| 2017 | 7 | 31.2 | 351 |
| 2017 | 8 | 40.4 | 880 |
| 2017 | 9 | 53.8 | 150 |
| 2017 | 10 | 65.3 | 47 |
| 2017 | 11 | 111.3 | 124 |
| 2017 | 12 | 110.7 | 9 |
| 2017 | 13 | 221.3 | 2623 |
| 2017 | 14 | 184.8 | 1017 |
| 2017 | 15 | 172.5 | 381 |
| 2017 | 16 | 120.8 | 143 |
| 2017 | 17 | 115.3 | 93 |
| 2017 | 18 | 126.7 | 64 |
| 2017 | 19 | 144.7 | 26 |
| 2017 | 20 | 171.5 | 171 |
| 2017 | 21 | 420.1 | |
| 2017 | 22 | 505.9 | 290 |
| 2017 | 23 | 272.9 | 307 |
| 2017 | 24 | 297.9 | 139 |
| 2017 | 25 | 238 | 235 |
| 2017 | 26 | 126 | 122 |
| 2017 | 27 | 129.6 | 156 |
| 2017 | 28 | 103.7 | 81 |
| 2017 | 29 | 109.3 | 25 |
| 2017 | 30 | 83.3 | 64 |
| 2017 | 31 | 73.9 | 50 |
| 2017 | 32 | 62.6 | 63 |
| 2017 | 33 | 56.9 | 65 |
| 2017 | 34 | 64.6 | 62 |
| 2017 | 35 | 56 | 26 |
| 2017 | 36 | 44.3 | 7 |
| 2017 | 37 | 37.7 | 25 |
| 2017 | 38 | 37.7 | 31 |
| 2017 | 39 | 33.9 | 17 |
| 2017 | 40 | 30.5 | 20 |
| 2017 | 41 | 30.5 | 6 |
| 2017 | 42 | 30.1 | 1 |
| 2017 | 43 | 30.6 | 1 |
| 2017 | 44 | 30.2 | 1 |
| 2017 | 45 | 27.4 | 0 |
| 2017 | 46 | 24.9 | 0 |
| 2017 | 47 | 25.7 | 0 |
| 2017 | 48 | 25.5 | 0 |
| 2017 | 49 | 21.9 | 3 |
| 2017 | 50 | 25.1 | 0 |
| 2017 | 51 | 33.2 | 2 |
| 2017 | 52 | 32.6 | 48 |
| 2018 | 1 | 29.1 | 5 |
| 2018 | 2 | 27.2 | 70 |
| 2018 | 3 | 25.9 | 23 |
| 2018 | 4 | 31.8 | 143 |
| 2018 | 5 | 34.4 | 60 |
| 2018 | 6 | 31.2 | 143 |
| 2018 | 7 | 33.1 | 262 |
| 2018 | 8 | 38.3 | 217 |
| 2018 | 9 | 33.5 | 84 |
| 2018 | 10 | 58.9 | 1054 |
| 2018 | 11 | 83.3 | 237 |
| 2018 | 12 | 66.7 | 42 |
| 2018 | 13 | 78.5 | 8 |
| 2018 | 14 | 126.1 | 330 |
| 2018 | 15 | 263.2 | 3709 |
| 2018 | 16 | 540.1 | 4398 |
| 2018 | 17 | 257.8 | 380 |
| 2018 | 18 | 231 | 45 |
| 2018 | 19 | 293.7 | 88 |
| 2018 | 20 | 204.9 | 120 |
| 2018 | 21 | 607.4 | 661 |
New turnover index of hay fever medication
Turnover index of hay fever medication is based on weekly sales figures obtained from Dutch pharmacies. This involves so-called self-medication products which are available without prescription at a pharmacy (drugstore). This type of medication is in the form of tablets, nasal sprays or eye drops which alleviate allergic reactions. These weekly data have been processed by the CBS Centre for Big Data Statistics (CBDS) into a weekly turnover index of hay fever medication. The turnover index is not designed to provide the total sales volume of hay fever medication in the Netherlands, but to give more insight into the development of weekly sales during the hay fever season and the purchasing moments of consumers. Read more about this innovative project on the innovation page.