Developing a material flow monitor for the Netherlands from national statistical data
About this publication
Effective monitoring of national circular economy policies requires consistent, national databases of material flows and environmental impacts. Yet, databases and indicators developed so far are scattered and inconsistent. To tackle this problem, Statistics Netherlands (CBS) developed a Material Flow Monitor (MFM) that integrates existing statistics using principles of the System of Environmental Economic Accounting (SEEA). The MFM is the physical counterpart of the Dutch Supply and Use Tables (SUT) of the National Accounts and is also referred to as physical SUT (P-SUT). The P-SUT captures national resource extraction, product imports and exports, product flows between economic sectors, as well as emissions and waste streams resulting from economic activities. Our work illustrates how a statistical office can use and enrich its formal statistical data to compose an MFM consistent with the National Accounts and how indicators can be extracted with a case study on the bio-based economy. We contribute a clear step-by-step description of the method and the used datasets. This supports the development of MFMs by other statistical offices and researchers, thereby enabling consistent and comparable circular economy monitoring. How to cite this study: Delahaye, R., Tunn, V. S. C., & Tukker, A. (2022). Developing a material flow monitor for the Netherlands from national statistical data. Journal of Industrial Ecology, 1–15. https://doi.org/10.1111/jiec.13365
1. Introduction
The transition to a circular economy (CE) is high on the agenda of many governments (Rijksoverheid, 2016; SITRA, 2016; Yuan et al., 2006;) and international institutions such as the EU and UN (European Commission, 2021; UNECE, 2021) as a means to realize a more sustainable economy. For example, the Dutch government aims to reach 50% circularity in 2030 and fully transform to a circular economy by 2050. At its core CE is a sustainability concept focusing on resource productivity (Blomsma and Brennan, 2017), specifically by reducing resource use, reusing materials and products (Kirchherr et al., 2017), and by substituting hazardous and non-renewable materials with more sustainable alternatives.
The transition to a CE calls for monitoring of material flows at the macro-economic level. Various indicators, tools and methods have been developed for this purpose (e.g., Geng et al., 2012; Jacobi et al., 2018; Mayer et al., 2019; Moriguchi, 2007; Aguilar-Hernandez et al., 2019). This diversity in itself is a challenge as these indicators lack comparability. Furthermore, most databases underlying such studies were developed on an ad hoc basis and therefore have not resulted in consistent time series (e.g., Merciai and Schmidt, 2018). Many material flow indicators (e.g., waste streams, reuse of materials) are disconnected from economic indicators (e.g., value added, employment) while circular economy monitoring inherently necessitates integration of such indicators.
Based on the monitoring challenges outlined above, Statistics Netherlands asked itself the following question: How can existing statistical data be integrated into a consistent database to monitor material flows in the Dutch economy? This question was addressed by developing the Material Flow Monitor database (MFM) which is now one of the pillars of Dutch circular economy monitoring efforts (see Hanemaaijer et al., 2021). The MFM is essentially a Physical Supply and Use Table (P-SUT). It is based on existing national economic-environmental accounting statistics and updated every two years to monitor developments of the material flows. It is used to monitor material flows in the Dutch economy and to calculate circular economy and bio-economy indicators.
In this study, we describe the steps and data used to compile the Dutch MFM and showcase the possibilities and limitations of using this state-of-the-art national MFM at different aggregation levels. Section 2 briefly reviews earlier work by the academic community and by Statistics Netherlands on which the MFM builds conceptually. Section 3 follows, explaining the principles and datasets used to create the MFM. Section 4 then showcases the potential of this database with a case study of the MFM for monitoring the bio-economy. Finally, section 5 discusses the possibilities and limitations of the MFM and draws conclusions.
2. Background
2.1 A brief history of economy-wide Material Flow Accounting
Building in part on the seminal work by Ayres and Kneese (1969), in the 1990s the scientific community set the first steps towards what later would become known as economy-wide Material Flow Accounting (ewMFA; e.g., Japan Environment Agency, 1992; Steurer, 1992; Bringezu, 1993; Bringezu et al., 1998; Matthews et al., 2000). These efforts built on statistics that had initially been developed for monetary flows such as the national accounts. Based on the national accounts, Statistics Netherlands developed a system for environmental indicators (Keuning, 1993) and set up several flow accounts, for example, for iron, steel and energy (Konijn et al., 1995).
Following on this scientific work, Eurostat, the statistical office of the EU, developed a methodological guide and preliminary material indicators for the EU15 in 2001 (Eurostat 2001a and 2001b). Another international organization, the OECD, contributed to the further harmonization of MFA methods (e.g., OECD, 2008). In 2011, the EU passed a regulation that enabled Eurostat to compile annual material flow statistics (European Union, 2011). While in principle ewMFA can be executed at various levels of aggregation, initially it mainly focused on national economies as a whole. This is illustrated by the use of indicators such as domestic material consumption (DMC, which equals domestic (resource) extraction plus mass of imports minus mass of exports) and gross domestic product (GDP) to analyze progress in decoupling material use from economic growth (Fischer-Kowalski et al., 2011).
An indicator like DMC does not adequately reflect the primary resource extraction required for imported and exported products. In an increasingly globalized economy, where traded goods have become a significant fraction of global GDP, this means the picture is incomplete (e.g., Wiedmann et al., 2014). In addition, more detailed insight into material flows at economic sector level is required to understand where the biggest inefficiencies occur and how material use drives emissions, land use, biodiversity loss and other impacts. This led to attempts to develop physical supply-use and input-output tables at national and global level (e.g., Pedersen, 1999; Moll and Acosta, 2006; Weisz and Duchin, 2006; Hoekstra and van den Bergh, 2006; Baud et al., 2011; Pedersen and Deveci, 2014; Kovanda, 2018; Merciai and Schmidt, 2018). Such developments serve to strengthen the CE agenda that has been developing since around 2010, as circular economy improvements tend to be quite product specific.
2.2 Materials and the UN System of Environmental Economic Accounts (SEEA)
Developing a material flow database that covers the entire economy requires an agreed set of definitions and principles. In the 1990s and first years of the new century, extensive research on the supply and use of materials was conducted in parallel in several countries, for example by Statistics Netherlands (e.g., De Haan, 2001; Hoekstra, 2003), Statistics Denmark (Pedersen, 2004; Pedersen and Deveci, 2014; Statistics Denmark, undated) and Statistics Finland (Mäenpää, 2005). The goal was to assess sustainable development by understanding the interactions between the economy and the environment. These efforts ultimately led to the development of the System of Environmental Economic Accounting (SEEA) by an international working group of statisticians (UN, 2014).
SEEA is an internationally agreed framework for integrating environmental-economic statistics, it provides definitions, classifications and a set of statistical principles to produce comparable statistics and accounts. The SEEA framework follows accounting rules similar to those of the System of National Accounts (SNA) making it very suitable for environmental-economic analyses and policy needs. SEEA covers three main areas: physical flows, stocks and environmental assets, and economic activities related to the environment. The area on physical flows includes physical supply and use table modules, such as the energy accounts, air emission accounts, water accounts, and the material flow accounts (for more information see: https://seea.un.org).
Statistics Netherlands links several of these SEEA modules to compile the Material Flow Monitor database. The modules are linked using SEEA definitions and principles; for example, inputs and outputs are balanced, the same units and classifications are applied, as well as a consistent scope of the economy (e.g., only residents are considered), and a definition of the scopes of different aspects of the socioeconomic metabolism (e.g., what is part of the economy and what is part of the environment?).
The comparability between the monetary figures of the national accounts and the physical figures in SEEA is very important for the compilation of productivity indicators. However, in some cases SEEA deviates from the national accounts in order to maintain focus on relevant material flows. An example of this is the harvest of crops: while the national accounts consider crops to be part of the economy, the Material Flow Accounts of SEEA regard harvested crops as a flow from the environment to the economy. Another difference between the national accounts and SEEA is the accounting of goods sent for processing: if the Netherlands sends crude oil to Britain for refining while ownership of the crude oil remains with the Netherlands, the national accounts record this as the import of a refining service by the Netherlands. In contrast, SEEA aims to record the actual flows crossing the border. By doing this, important indicators like emission coefficients, such as CO2 emission per unit of production, remain comparable in time and across countries.
2.3 Indicators for the circular economy and the bio-based economy
To accelerate the EU’s transition to a circular economy, the European Commission adopted the new Circular Economy Action Plan in March 2020 (European Commission, 2021). It is one of the main blocks of the European Green Deal, Europe’s new agenda for sustainable growth. The action plan states that monitoring must rely on European statistics as much as possible.
To monitor the progress of the transition towards a circular economy, indicators have been developed by academics (e.g., Moraga et al., 2019; Saidani et al., 2019), policy makers (e.g., Eurostat, 2022a; Hanemaaijer et al., 2021), and consultants (e.g., Circle Economy, 2021). Progress towards the circular economy can be measured using indicators at micro, meso and macro level (Kristensen and Mosgaard, 2020; Mayer et al., 2019; Saidani et al., 2019). Many available circular economy indicators relate to the preservation and use of materials and production of waste. Saidani et al. (2019) provide a comprehensive review of circular economy indicators and classify these by the level and circular economy strategy they measure. Recently, macro-economic indicators were developed to monitor the circular bio-economy (Kardung et al., 2021).
While the present study focuses on macro-economic material flows based on national statistics, we wish to highlight that it is crucial to combine these indicators with indicators that monitor environmental effects (e.g., environmental and CO2 footprints) to ensure that the circular economy transition does in fact contribute to sustainable development (Haupt and Hellweg, 2019; Helander et al., 2019). Previous studies, like that by Mayer et al. (2019), have taken an economy-wide perspective at the national or higher scale and not at the level of individual products or industries. Their approach is especially interesting in the context of this study, as they developed an ewMFA for the EU28 and derived circular economy indicators from it.
While many circular economy indicators are being developed, these are often difficult to compare and connect due to differences in coverage of and definitions in the underlying datasets. For example, De Jongh et al. (2022) outline and discuss the differences and objectives of different waste-statistics produced in the Netherlands. The large number of different indicators produced using different datasets and methods by academics, consultants and policy makers can result in disconnected and seemingly inconsistent indicators that make it difficult to coherently monitor the circular economy.
2.4 Research gap and contribution
In order to monitor the circular economy, a database is needed. A macro-economic MFM built from national statistics could be the solution but needs to be regularly and consistently updated to provide reliable circular economy indicators. To achieve consistency in time and across countries, this study proposes using existing national statistical data and integrating these using the existing SEEA statistical framework. This method developed by Statistics Netherlands (see Van Berkel and Delahaye, 2019) is an expansion of the one Mayer et al. (2019) presented and allows for disaggregation of material flows to the level of products and sectors. This is necessary for circular economy monitoring as policy targets are increasingly industry specific.
With this study we contribute an accessible step by step description of the method used to compile an MFM for the Netherlands from national statistical data and illustrate the possibilities and limitations of using this state-of-the-art national Material Flow database at different aggregation levels through a case study. Other EU countries and Eurostat have similar data, and the method developed by the Dutch CBS hence could be an example for CE monitoring in other countries. The MFM could thus contribute to more consistent monitoring of the circular economy transition in Europe. The MFM is a useful source of information for policy makers as it is consistent with economic figures of the national accounts, links several environmental modules on resources, waste and emissions, results in consistent time series, and provides opportunities for economic-environmental analyses.
3. Method: compiling the Material Flow Monitor Database
The MFM contains data on material flows into, within, and out of the Dutch economy and is essentially a physical supply and use table. More specifically, it comprises the supply and use of natural resources, goods and residuals specified per sector and for households. In the columns it distinguishes 130 sectors, imports and exports, final consumption like government, households and investment, and environment. The rows consist of close to 400 products and the ensuing physical extensions as sixteen waste categories, CO2 emissions and extraction of ten types of natural resources including crops. We provide an aggregated version of the MFM 2018 as supplementary information and the current, detailed version of the Dutch MFM is available upon request from Statistics Netherlands.
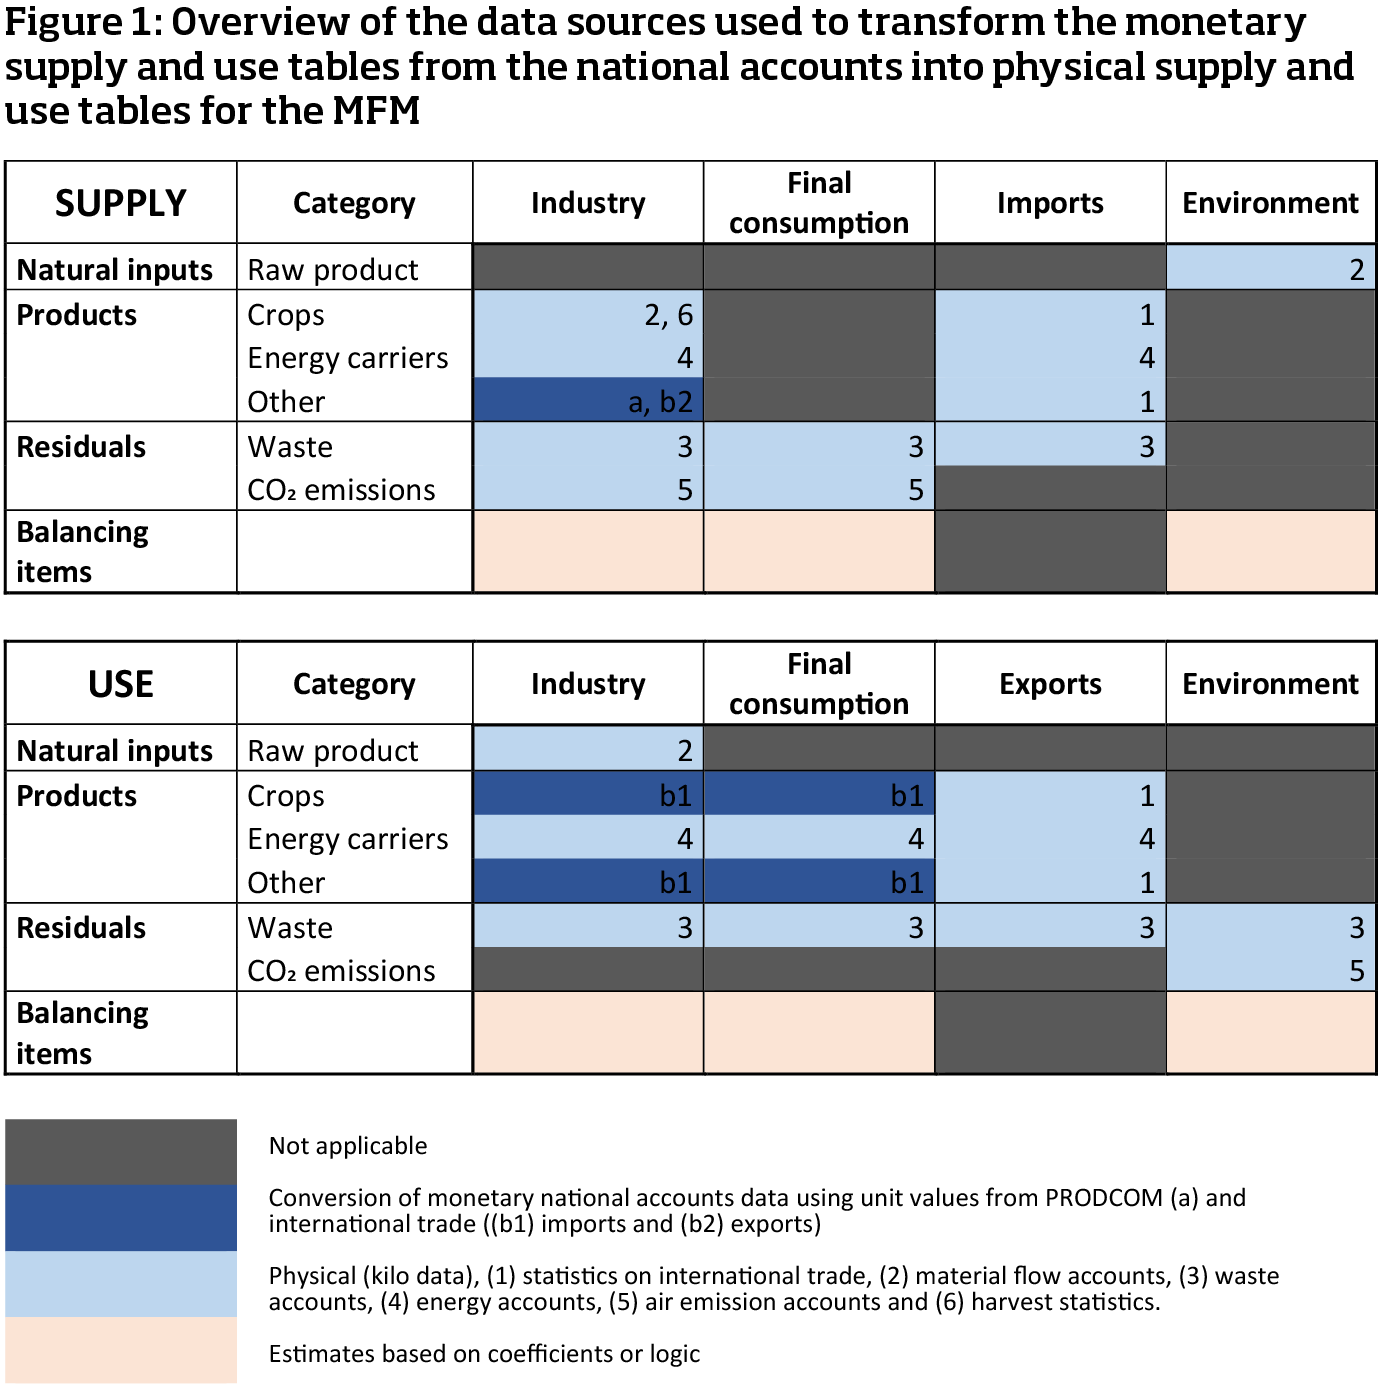
To compile the MFM, several Statistics Netherlands datasets need to be linked. More specifically, datasets on extracted and harvested goods, traded and produced goods, waste streams and emissions have to be combined. These datasets are mostly mandatory statistics based on surveys and data from national registers (e.g., trade registered by the Dutch customs authority). Figure 1 visualizes where the different datasets are applied to transform and extend the monetary supply and use tables from the national accounts into physical supply and use tables for the MFM. The main steps to develop the MFM are summarized in Table 1 below.
| Steps | Description | Datasets |
|---|---|---|
| Step 1 | Compile monetary supply and use tables (SUT) for products and services in basic prices. | National accounts supply and use tables |
| Step 2 | Convert monetary SUT of products to physical SUT. | Unit values derived from Prodcom, international trade data, agriculture statistics |
| Step 3 | Replace product flows in step 2 with available physical data. | Physical Energy Flow Accounts, international trade statistics, agriculture statistics |
| Step 4 | Add residual and natural resource material flows. | Waste statistics, material flow accounts, air emission accounts. |
| Step 5 | Add balancing items (e.g., O2 emissions for combustion processes, water uptake/loss products). | Conversion factors taken from MFA handbook (Eurostat, 2018) |
| Step 6 | Reconcile the supply and use (both per material and per sector) manually to a difference of max. 10%. | Not applicable |
| Step 7 | Reconcile the supply and use by automated modelling for the remaining differences. | Not applicable |
3.1 Compilation of monetary supply and use tables (SUT) in basic prices
Monetary supply and use tables are compiled annually at Statistics Netherlands as a subsystem of the national accounts according to internationally agreed standards (UN, 2009). The tables describing the supply and use of goods and services are published for 95 commodities in 81 sectors (CBS, 2021). For the MFM more detailed supply and use tables are used that are only available from Statistics Netherlands under strict confidentiality conditions. The supply table is available in basic prices. The use table is converted to basic prices too, by excluding margins, subsidies etcetera from the monetary value of products. In this way the monetary values become more consistent with the unit values applied for the conversion to kilos (see section 3.2).
As our aim is to estimate physical flows into, within and out of the economy, the second step entails changing the monetary supply and use tables to represent physical flows. In the national accounts, goods sent abroad for processing and returned – and vice versa – are not recorded as imports and exports of commodities but as imports or exports of processing services (Hiemstra, 2014). For example, the export of crude oil by British Petroleum to the Netherlands for refining and subsequent imports of the resulting petrol are recorded as the export of a refining service by the Netherlands in the national accounts if British Petroleum retains ownership of the crude oil/petrol. . In the MFM, we want to record these material flows as import of crude oil and export of petrol. To include such material flows, we add them to the monetary supply and use tables. Goods sent for processing and production abroad play a substantial part in the Dutch economy because the Netherlands is a small country with an open economy. In larger countries, these corrections might not be necessary if goods are not imported and exported for processing on a relevant scale.
3.2 Conversion of monetary SUT to physical SUT
Monetary supply and use tables are converted into physical supply and use tables using unit values, the price per kilo for a set of goods (dark blue cells of figure 1). As unit values may vary within one product group, they can differ on the supply side and the use side and per sector. Several sources are used to compile the set of unit values: production statistics (Prodcom), international trade statistics, and data on agriculture. We prioritized these sources based on quality as they may have unit value information on the same product group m. The agriculture data are considered to be the strongest source on the supply side, followed by Prodcom and lastly international trade statistics. Fewer sources are available on the use side; here unit values are derived solely from international trade statistics.
3.2.1 Deriving unit values from Prodcom data
The production statistics of manufactured goods, known as Prodcom (Eurostat, 2022b), provide information on the supply of approximately 4000 products by the mining and manufacturing sectors. They record both physical volumes (kg, m2, number of items, etc.) and financial values of sold products. To derive unit values, all physical volumes are converted to kilos using Eurostat conversion factors (Eurostat, 2021).
The advantage of Prodcom is that it provides data on heterogeneous goods for the various sectors. This means that different unit values are found depending on the sector supplying the product. The Prodcom data on kilos and values are based on a sample (excluding companies with fewer than 20 employees), so not all companies in a sector are represented. This does not affect the information on unit values much but simply adding up the data on kilos would result in an underestimation of the total production volume.
3.2.2 Deriving unit values from international trade data
The international trade dataset of Statistics Netherlands comprises imports and exports declared to the Dutch customs (extra EU trade) or reported by companies (intra EU trade). Within the EU, only trade above a certain value needs to be reported, Statistics Netherlands estimates the missing values. The international trade data contain detailed information on the type, value and weight of imported and exported goods.
The international trade data are used to derive unit values for most goods covered in the MFM (except for a few non-traded goods). These unit values are quantity-weighted averages of the different prices for which the products are purchased or sold. Some commodities are not recorded in kilo units (e.g., pieces or m2) and need to be converted to kilos first. For the supply tables, the unit values are used if no information is available in the agriculture statistics or in the Prodcom. Unit values of imported goods are used for the use side and unit values of exported goods for the supply side as some used goods are imported and some supplied goods are exported.
3.3 Improving and adding material flows
Only products with a monetary value are covered in the monetary SUTs. Therefore, sesiduals and natural resources are missing and need to be added. Physical data for some products are directly available from other sources (light blue cells in figure 1).
3.3.1 International trade
The international trade data also replace import and export figures from the monetary supply and use tables as the international trade data are considered to be more accurate. These figures overrule the imports and exports of the first estimates in the base table. Imports can be directly inserted in the supply table. Exports are divided between re-exports and exports from domestic production using the ratio of these variables from the monetary use table. Re-exports cannot exceed imports as by definition re-exports need to be imported first. Similarly, exports cannot exceed domestically produced products. These rules are taken into account throughout the entire process of compiling the MFM.
3.3.2 Energy carriers
Outcomes of the unit value estimations of energy carriers are replaced by physical data. Flows of energy carriers are derived from the Physical Energy Flow Accounts (PEFA), the SEEA energy accounts as implemented by Eurostat (2014; 2022c). Three adjustments are required to make this dataset compatible with the MFM.
First, the data in the PEFA are in tera joules (TJ) and need to be converted into million kilos. The conversion factors – taken from the MFA handbook (Eurostat, 2018) – differ per energy carrier. Some energy carriers, such as electricity, have no physical entity and are set to zero.
Second, PEFA categories of energy carriers need to be allocated to the energy carrier classification used in the MFM. Three extra energy carriers (goods) are added to the supply and use tables These are solid, liquid and gas biomass used for energy production.
Third, sectors in the PEFA need to be disaggregated to match the granularity of the sectors in the MFM. For example, ‘agriculture’ in the PEFA is divided into arable farming, horticulture, livestock farming, other agriculture, and agricultural services to match the MFM. To break these figures down correctly, multiple sources are used as a proxy for the division, among which the CO2 emission registration, the monetary tables of the national accounts, and the Energy balance sheet (CBS, 2022a). This results in data on the supply and use of energy carriers according to the categories of the MFM.
3.3.3 Additional data sources for agricultural yields
A separate source is available for unit values of agricultural goods such as grain, potatoes and flower bulbs. However, using these agricultural data alongside data from international trade still leaves a few cells empty. The missing unit values, for example for raw milk and cannabis, are found using websites.
3.3.4 Waste
Data on the production of waste are taken from the waste accounts (CBS, 2022b). Comparable data are collected by Eurostat for all EU countries. For these data too it is important that the granularity of the sectors (NACE codes) matches the level of detail in the MFM. This means more detail is needed than the Eurostat waste statistics provide. For the production of waste, NACE codes are broken down on the basis of monetary production figures from the national accounts and expert guesses.
On the use side, Eurostat publishes only the type of waste treatment. The allocation of waste use by NACE category is based on expert estimations. Recyclable waste is mostly used by the Materials recovery sector (NACE 38.3) for conversion to recovered products. Mineral waste, which accounts for a large part of the total produced waste, is mostly used in construction as foundation for roads and houses. Other waste is incinerated or, to a small extent, landfilled by the waste treatment sector.
CBS uses import and export figures on waste from the waste accounts. Companies are required to report trade of hazardous waste listed on the so-called red and orange lists. Trade of non-hazardous or ‘green’ waste is taken from trade statistics using a list of Combined Nomenclature waste codes compiled by Eurostat.
3.3.5 CO2 emissions
Data on CO2 emissions come from the annual air emissions accounts (Eurostat, 2022d). CO2 is supplied by sectors and used by the environment. Source data are available at aggregated sector level; allocation to the detailed MFM sectors is based on the ratio of the different emission relevant energy carriers, taking stationary and mobile emitters into account. Monetary supply and use tables are also used for the sector allocation. Data on CO2 emissions from non-combustion processes, such as chemical processes, are taken from the Pollutant Release and Transfer Register (for more information see http://www.emissieregistratie.nl).
Other type of emissions, CH4 and NOx, are not taken into account in the current MFM, as in weight terms these emissions are relatively small. However, for analytical purposes it might be interesting to add these emissions in future editions of the MFM.
3.3.6 Recovered products
In the Materials recovery sector (NACE 38.3), waste is collected and prepared for recycling. The physical (kilo) input of waste and the production of recycled materials are taken from Statistics Netherlands dataset Delivery and processing of waste at recycling companies (CBS, 2022c). The amount of recovered products and materials is estimated by subtracting produced waste from total collected waste. The use of recovered products produced by this sector and by other sectors is estimated using expert guesses. Further, we assumed that no products from this sector are imported or exported as no data are available.
3.3.7 Extraction
Many production processes use resources that are extracted from the environment. The MFM also classes crop harvesting by agriculture as a form of extraction. The environment is included as a separate sector in the MFM. Extraction is divided into crops, animal feed, wood, fish, salt, limestone, clay, sand, gravel, natural gas and crude oil. Data on extraction are taken from the Material Flow Accounts (MFA).Volumes of crops are allocated to the relevant agricultural sectors by the crop statistics (CBS, 2022d).
Some resources are extracted by more than one sector which makes the allocation in the use tables more difficult. For example, allocating salt extraction to the relevant sectors is done by looking at production data at company level. In the Netherlands, companies from the mineral and quarrying sector, and the chemical sector extract salt.
A number of checks are built in to ensure data validity: the supply of a certain good may not exceed extraction for example. The reason for this is that it is not possible to produce more of a product than goes into the production process. For example, the supply of agricultural goods cannot exceed the extraction of crops. Similarly, the supply of crude oil and natural gas should not exceed the extraction of crude oil and natural gas.
3.4 Adding balancing items
The physical supply and use tables need to be balanced and balancing items are added for material flows that are not recorded in the used statistics. The balancing of the physical supply and use tables follow the reconciliation rules of the monetary supply and use tables. Supply equals use for each good, as all materials supplied have to be used and input must equal output for each sector: industrial processes transform materials and products and either use or emit substances such as carbon dioxide, water, and oxygen. In order to balance sectors, balancing items are introduced (light pink cells in figure 1). The major balancing items are related to the uptake and emission of substances during the combustion of energy carriers, the gain or losses of water in products during the production process, and the service sectors like restaurants, that use materials but only produce services.
3.4.1 Combustion processes
For each sector a mass balance for energy combustion must apply: combustion of energy carrier plus O2 equals CO2 plus H20. Energy carriers and CO2 are already part of the MFM; O2 and H2O need to be introduced as balancing items.
The environment supplies O2 which is used by industry when combusting energy carriers. O2 intake can occur in two ways: by binding with carbon and by binding with hydrogen. To calculate O2 use during fuel combustion, the conversion factor of the O2 input per emission of CO2 is used. Similarly, the oxygen requirement for the oxidation of the hydrogen incorporated in the combusted material is determined. These two values of O2 (from CO2 and H2O) are added together.
H2O emissions occur during combustion processes in two ways. Hydrogen interacts with O2 during combustion processes, causing emission of H2O and the moisture content of the energy carrier evaporates. There are different conversion factors to estimate the O2 and H2O balancing items. The conversion factors are related to the emission-relevant energy carriers and the combustion-related CO2 emissions. We take the conversion factors from the MFA handbook (Eurostat, 2018).
3.4.2 Respiration (O2, H2O, CO2)
The respiration of humans and farm animals uses O2 and emits H2O and CO2 to the environment. Humans and domesticated animals are accounted for as part of the economy, and therefore the material flows are included in the balancing items. The number of farm animals are multiplied by their respective O2 use per year and allocated to the sector livestock farming. The human population in the Netherlands is also multiplied by the O2 use per person per year. This is allocated to the sector households. The data on the number of humans and livestock are compiled by Statistics Netherlands. Conversion factors are taken from the MFA handbook (Eurostat, 2018).
The same method is applied to calculate the CO2 and H2O supply of livestock and humans. The emission per animal and person of CO2 and H2O are multiplied by the number of animals and people and allocated to the supply of CO2 and H2O by livestock and households.
3.4.3 Nitrogen for the Haber-Bosch process
Nitrogen is taken from the air for the industrial production of ammonia (for fertilizer) in the Haber-Bosch process. The production of ammonia is multiplied by the conversion factor of ammonia to nitrogen. The nitrogen is used by the fertilizer industry and supplied by the environment. Data on the production of ammonia come from Prodcom. The factor to convert ammonia to the amount of nitrogen input is taken from the MFA handbook (Eurostat, 2018).
3.4.4 Water loss and addition
Bulk water is not part of the MFM. As a result, bulk water added during the production process causes an imbalance in sector input and output. For example, in the beverage industry, bulk water is added to produce beverages. Hence, the input (that does not include bulk water input) is much smaller than the output (that includes bulk water incorporated in the products).In addition, the water content (moisture) of products can change during the production process. For example, loss of water occurs while producing cheese from milk.
To determine the amount of water that is added or lost during the production process, we estimated the water content of all product groups based on literature. These water content coefficients are multiplied with the physical supply and use tables at the time the supply and use of goods are balanced by hand (differences below 10% remain). The result is a rough estimate of the water balance (loss or gain) for each sector. Due to the lack of data quality, this balance is only used as a reference figure while balancing the input and output of the sectors.
3.4.5 Service sector and other balancing items
The final balancing item added to the physical supply and use tables encompasses more than one kind of good used as input by the service sector. For example, construction sectors use a lot of materials such as sand and gravel. However, on the supply side there is barely any output because the national accounts record constructions such as buildings not as physical output but as a service. Services have no material component. The use surplus is therefore added to the supply of these sectors as a balancing item. In the agricultural sectors there is a lot of use of manure and fertilizers that is not part of the output, this is also accounted for in the balancing item on the supply side. A balancing item on the use side is also possible. For example, in a public economic sector like rail transport, waste produced by customers is not matched by the input of this sector.
3.5 Reconciling supply-use and input-output
The result of the methodology described in this chapter is a physical supply and use table. However, due to uncertainties of the different data sources and estimation methodologies, supply does not always equal use, even after inserting balancing items. The final step in completing the MFM is to reconcile the supply and use of goods and the input and output of sectors. Large differences are investigated and solved by hand and remaining smaller discrepancies are eliminated by modelling.
3.5.1 Manually
Any large differences are investigated and solved manually. Differences are considered to be large if they are more than 10% of the supply or larger than 1 billion kilos for goods or sectors. In order to be able to reduce balance differences, the source data need to be adjusted. Data considered to be least plausible are adjusted most. These are data which require the most assumptions to establish an estimate, often data on domestic use of products and waste. We present the balancing rules applied by Statistics Netherlands to create the MFM in Table 2 below.
| Part | Category | Flows that need to be in balance |
|---|---|---|
| Rows | Natural inputs | Extraction from environment = Domestic intermediate use industry |
| Products | Import + domestic production industry = Domestic intermediate and final use + export | |
| Residuals | Import + domestic production + final consumption domestic = Domestic intermediate and final use + exports + release to environment | |
| Columns | Industry | Input natural resources + products + residuals + balancing items = Output products + residuals + balancing items |
| Total PSUT | Total supply and total use | Supply = Use |
3.5.2 Modelling
The second step of data reconciliation is modelling to remove smaller discrepancies. We use a modified version of Stone’s method which is a generalized least-square method that “adjusts data in order to satisfy a set of linear constraints” (Eurostat, 2022e). The constraints make sure that a relation between two variables is fixed or remains within certain limits. The standard constraints are as follows. Supply equals use of goods and input equals output of sectors. Also, imports should equal or exceed re-exports as by definition re-exports need to be imported first. Similarly, domestic production cannot exceed exports. Additional constraints are inserted to create logical material flows. For example, the supply of processed meat may not exceed use of livestock and use of processed meat by abattoir. Additional calculation rules are explained in section 3.3.6 on extraction.
We slightly modified Stone’s method by introducing reliability weights in order to improve the figures (Bikker et al., 2012). The weights are devised to ensure that the figures deemed most reliable are modified least. Furthermore, the method allows exogenous variables, whose values must remain unmodified. For the MFM, the supply side is considered more reliable than the use side because more source data are available. Also data on international trade, energy carriers and extraction are considered to be robust. Data on the use of secondary materials by industry are considered the least reliable. The results of the model are always compared to the input. If it turns out that solutions found by the model are not plausible, further adjustments are made by hand to the original SUTs, after which the model is rerun.
3.6 Developing time series
Time series can be compiled by repeating the described methodology for every additional year However, repeating this method is not ideal for obtaining consistent time series if the underlying statistics change due to revisions. We divert to developments in time instead of actual data when consistencies over time are compromised because source data are revised. During a revision, new insights or definitions are implemented. In order to maintain a time-consistent MFM, we can no longer use the exact source data for an additional year. In this case, time series are compiled by applying the developments in time of the source data to the base year MFM. Data for a new year (t+2) are estimated by multiplying developments over time with the base year t. For example, if the source data from the emissions accounts report an increase in CO2 emissions of 6% between t and t+2 then the CO2 emissions of the MFM are increased by 6% to obtain the t+2 MFM.
Second, the methodology described in this chapter can be a time-intensive process that will not necessarily deliver the most consistent time series. This is the case for the MFM product categories that are estimated by converting monetary units to kilos by using unit values. Instead, for the supply and use of products the monetary volume development over time is used to estimate an additional year. By taking monetary developments in constant prices, volume changes due to price changes are ruled out. However, a disadvantage of this methodology is that quality improvements are also recorded as volume increments. For example, the recorded volume of a PC doubles when its performance doubles, even if its weight stays the same.
The longer the period between the base year and the years estimated by developments over time, the more the MFM figures deviate from the current state of affairs. Therefore, a periodic revision of the MFM is undertaken to implement changes in the source datasets and classifications, and to include new datasets if applicable. The MFM follows the revision strategy of the national accounts as closely as possible. For the national accounts, following EU policy, a revision takes place approximately every 5 to 6 years. During these revisions, new European guidelines are implemented, classifications are improved, new source data are applied and methodological adjustments are implemented.
After a revision, the MFM also needs to be revised retrospectively to achieve a consistent time series. When the MFM is revised, the revision is implemented for the base year of the most recent MFM. For this base year there are then two versions of the MFM: the revised and the unrevised version. The revised MFM is then extrapolated back in time to create a consistent, revised time series for earlier years. Developments back in time are derived from the unrevised MFM and applied to the revised base year.
4. Case study: measuring the bio-based economy with the Material Flow Monitor
The MFM is used as the basis to calculate a range of circular economy indicators such as resource efficiency, dependency and substitution (see Hanemaaijer et al., 2021). These indicators are compiled at national and sector level. Substitution can occur between primary and secondary resources but also between abiotic and biotic resources. Replacing abiotic resources with biotic resources is also a CE transition strategy, and the MFM can be used to measure the bio-based economy. The MFM allocates products and materials to different material categories – biomass, fossil, metals and minerals – based on largest material content. Thus, many products in a particular category also contain other materials. For example, cars are allocated to ‘metal’ although they also contain plastic and rubber. Similarly, diesel and petrol are allocated to ‘fossil’ while they contain a small share of bio-based fuel. As the bio-based shares of such products are not evident from the MFM, this part of the bio-based economy is not covered.The following case study demonstrates how the MFM can be extended in order to measure the bio-based economy in the Netherlands, and showcases the potential and the limitations of the MFM.
4.1 Approach
The method used to extend the MFM so that it captures the bio-based economy better, was first developed in the European Horizon 2020 BioMonitor project (see https://biomonitor.eu) and subsequently improved as part of the Dutch Work Programme Monitoring and Steering Circular Economy 2019–2023 (Hanemaaijer et al., 2021).We distinguish between the bio-economy and the bio-based economy. “The Bioeconomy encompasses the production of renewable biological resources and their conversion into food, feed, bio-based products and bioenergy.” (Nattrass et al., 2016, p.15). Renewable biological resources comprise products obtained from agriculture, forestry and fishery. For the sake of brevity, here renewable biological resources are referred to as biotic materials. The bio-based economy is a subset of the bio-economy and encompasses the conversion of biotic materials into bio-based materials, products, fuels and energy sources. Below we call these bio-based materials.
To monitor the bio-based economy, the MFM tables are first converted to dry matter and then extended by applying bio-based coefficients to the products. Coefficients to convert products to dry matter were taken from Gurría et al. (2017) and Merciai et al. (2014). The coefficients for the bio-based content of goods were estimated by the NOVA institute as part of the BioMonitor project. The bio-based coefficients were developed for goods in the Prodcom list of goods and services (see section 3.2.1 for more information about Prodcom). By linking the Prodcom classification of goods with the MFM classification of goods, it is possible to estimate the bio-based share of the MFM. The coefficients were used to divide plastics and other relevant product categories into biotic and abiotic shares, resulting in separate supply and use tables for biotic and abiotic materials. The supply and use tables for both biotic and abiotic materials had to be balanced again for each good and each sector. Based on the extended MFM, several indicators were explored: biotic and bio-based production, substitution, cascading and use of secondary biotic materials in the Netherlands. These indicators were subsequently validated during an online workshop with nine bio(-based) economy experts from policymaking, academia, and industry.
4.2 Findings
This section discusses the findings for each indicator and provides the key insights from the expert workshop.
4.2.1 Biotic and bio-based production
The production of biotic and bio-based products can be used as an indicator to estimate the size of the bio-based economy. To obtain this indicator, we labelled the MFM product categories that met the above stated definitions of the bio-economy and bio-based economy as biotic and bio-based. We then used the supply table of the MFM to calculate the biotic and bio-based share of the total production. Notice, however, that adding up all sectors leads to double counting as the output of one sector is the input of another. In terms of weight, only 19% of Dutch production is part of the bio-economy and only 6% part of the bio-based economy. The outcomes are presented in Table 3 below.
| Production | kilotons | percent |
|---|---|---|
| Abiotic production | 251,064 | 81% |
| Biotic production (includes bio-based production) | 57,854 | 19% |
| Bio-based production | 17,076 | 6% |
| Total production | 308,918 | 100% |
To validate these indicators we compared them with previous research. Gurría et al. (2020) analysed biomass flows in Europe with Eurostat data. They report a supply of biomass of approximately 49 billion kilo in the Netherlands in 2017. Given the uncertainty of the figures, this can be considered within the same range as the 57.9 billion kilo biotic production we found (see Table 3). However, there is a large discrepancy in the bio-based production; we found 17 billion kilo while Gurría et al. (2020) reported 4.5 billion kilo supply of biomass not used for feed and food. This discrepancy is likely a result of the bio-based shares we applied to composite products. This different scope of bio-based production can also partly explain the difference in total reported biomass.
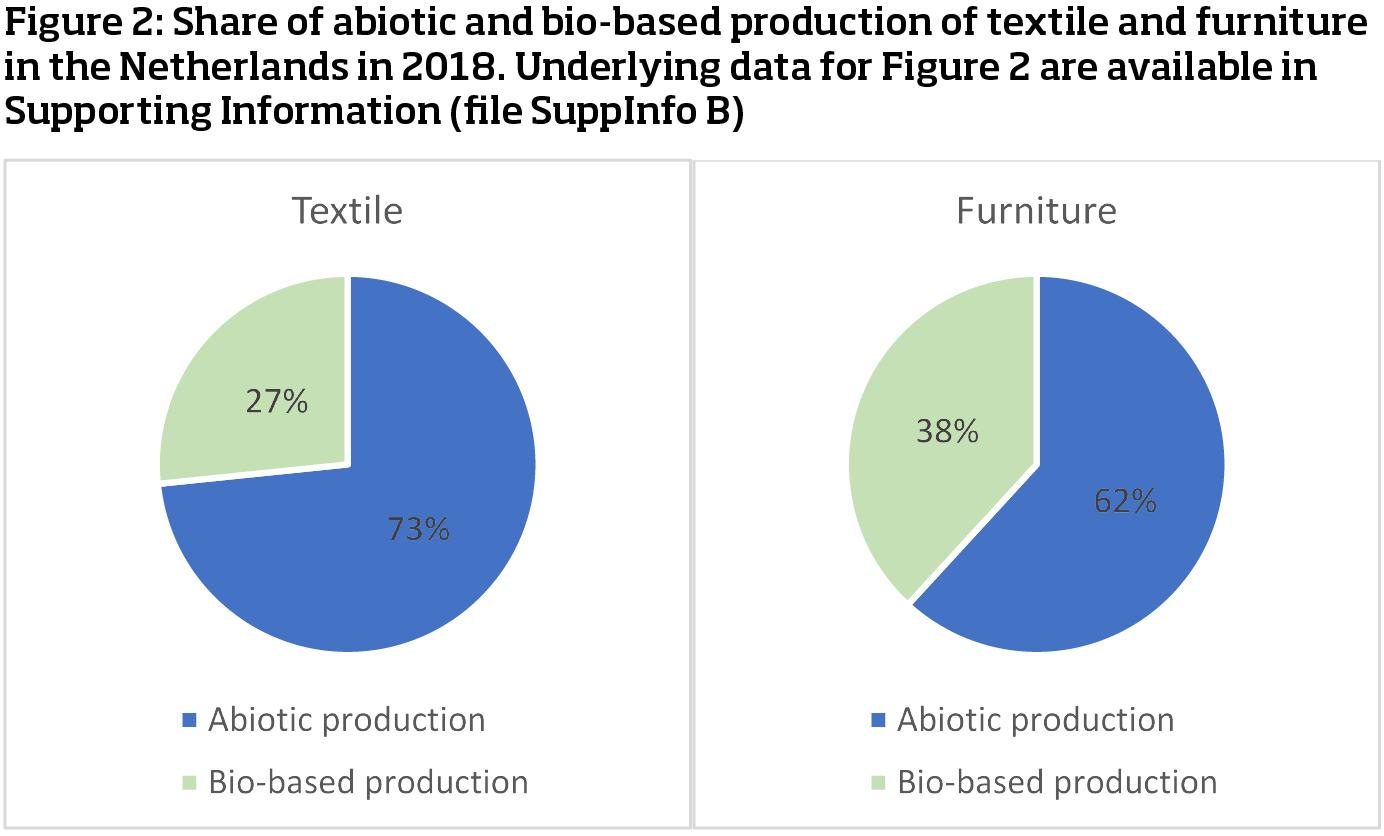
The extended MFM can also be used to derive indicators for sectors’ bio-based production. For example, textiles produced in the Netherlands are 27% bio-based, while 38% of furniture is bio-based (see Figure 2). Within textiles, carpets account for the largest volume of bio-based material, for furniture this is office furniture.
The production indicator is useful to show the share of biotic and bio-based production of the economy and of aggregated sectors. It shows clearly that until now only a small part of production in the Netherlands uses bio-based materials. This finding did not spark a discussion during the expert workshop. Due to the high level of aggregation, the indicator is probably not suitable for annual monitoring, as small developments would not be visible. It might show progress after five or ten years if there are major shifts towards bio-based production in the Netherlands; however, for this purpose country-specific bio-based shares need to be developed and periodically updated. Another option is to monitor sectors that have a high potential for a bio-based transition. We recommend validating the reliability of indicators at sector level by sector experts.
4.2.2 Use of biotic residuals
In the bio-based economy, biotic residuals are reused as much as possible. The extended MFM can be used to determine in which economic sectors biotic waste and recycled biotic materials are used. For this indicator, we do not distinguish between residuals from biotic materials and bio-based materials and refer to them as biotic residuals. To explore this indicator, the biotic use table of the extended MFM for 2018 is used. The MFM does not include residuals that are reused within an organization. For example, manure produced and used as fertilizer on the same farm is not recorded.
According to the extended MFM, 12,095 kilotons of biotic residuals were reused in the Netherlands in 2018. To gain more insight into the use of the biotic residuals we clustered the sectors in four groups.
1. industry: all manufacturing, e.g., textile, chemical and pharma
2. food sector
3. agricultural sector: livestock and plant cultivation
4. generation of energy.
Nearly one third of biotic residuals are used for energy generation, just under a third by industry and a quarter are used in agriculture. Details are provided in the table below. The numbers give an order of magnitude for the reuse of biotic residuals in different sectors but require further validation.
| Reuse of biotic residuals | kilotons | percent |
|---|---|---|
| Industry | 3,462 | 29% |
| Food and feed | 1,817 | 15% |
| Agriculture | 2,993 | 25% |
| Energy generation | 3,823 | 32% |
| Total reused biotic residuals | 12,095 | 100% |
4.3 Case study conclusions and recommendations
The indicators derived from the extended MFM show that the bio- and bio-based economy in the Netherlands is still relatively small compared to other material flows. The case study also illustrates how data from the MFM can be used to reveal connections between different sectors, for example how biotic residuals are reused in other sectors. This macro-economic perspective captures the overall trends of biotic material supply and use. Overall, the extended MFM is useful to establish a baseline for the bio-based economy. The method can be further improved for monitoring, aided by the addition of more bio-based materials and products to statistical classifications in the future, which will help to monitor the developments more precisely.
The case study demonstrates how the MFM can be used to develop macro-economic material flow indicators. Developments in one sector can be placed in the context of the entire economy to determine the order of magnitude of a trend. In addition, the close link between the MFM and the national accounts makes it easier to develop related economic indicators such as value added and employment in the bio-based economy. The aggregated data of the MFM are quite robust as they are the result of the confrontation of several data sources and because the figures are checked at an aggregated level. The case study illustrates that data from the MFM at a very detailed level need to be checked thoroughly as they might not be sufficiently reliable to derive developments over time. This is because different statistical datasets are integrated that each have an uncertainty margin, in addition, assumptions have to be made to compile the MFM figures and judgement calls are necessary to reconcile the supply and use data.
5. Discussion and conclusion
We presented the method used by Statistics Netherlands to compose an MFM from national statistical data and a case study that demonstrates how indicators can be derived from it. The method contributes to the need for consistent monitoring of material flows in the transition towards a CE. Consistency is achieved by applying statistical principles of the SEEA. The main contribution of this research is the detailed and accessible description of the method of compiling a consistent national MFM database from which CE indicators can be derived. It is important to note, however, that details of the presented method are adjusted when better quality datasets become available or new insights show that the MFM can be improved.
While several countries have experimented with setting up similar systems to the MFM, most notably in the form of physical supply and use tables (see Baud et al., 2011; Kovanda, 2018; Pedersen, 1999), the Netherlands is now one of the few countries that has been developing such a database on a regular basis for over a decade. This has various benefits. Linking existing datasets means that the MFM can be produced consistently on a regular basis which is crucial for monitoring policy effects. For example, this enables the compilation of consistent time series without collecting additional data, and given its consistency with economic accounts it allows for combined environmental-economic assessments (e.g., Pedersen, 1999; Moll and Acosta, 2006; Weisz and Duchin, 2006; Hoekstra and van den Bergh; Pedersen and Deveci, 2014; Kovanda, 2018; Merciai and Schmidt, 2018).
One limitation of the MFM is that the reliability of the most detailed data available cannot be easily verified. The reason for this is that data are collected from sources of varying quality, and often no alternative data sources are available. Therefore the MFM is only published in a relatively aggregated form, and any calculations of indicators at a more detailed level need to be used with caution. So, in addition to the MFM other methods and additional data collection are required to closely monitor material flows in specific sectors or for specific products. The introduction of specific statistical codes for CE-related or bio-based products in classifications would help improve data quality. We also recommend further research to assess and validate the quality of the MFM data on the macro and micro level.
The MFM has become a cornerstone for the development of a Dutch circular economy monitoring framework (see Hanemaaijer et al., 2021). The case study demonstrates that the MFM is a useful tool to extract indicators measuring material flows at the macro-level. The benefit of the MFM is that it provides an overview of all the material flows, ensuring that overall trends in material flows become visible. This is crucial because circular economy policies could lead to shifts in material intensity between sectors and cause rebound effects. In order to monitor the circular economy comprehensively, indicators derived from the MFM should be combined with indicators measuring specific circular economy strategies (e.g., reuse and repair), the reduction of consumption levels and – perhaps most importantly – environmental impacts.
Finally, it is important to realize that similar datasets to those used by Statistics Netherlands are available in other EU countries as they are compulsory under EU regulations. Such detailed data on monetary supply and use tables are often only accessible for national statistical offices. It therefore seems feasible for national statistical offices in other European countries to use a similar approach to develop an MFM. In this context, we encourage collaboration between academic researchers and national statistical offices to develop MFM to improve the quality and comparability of CE indicators in Europe.
Acknowledgements
References
Aguilar-Hernandez, G.A., Sigüenza-Sanchez, C.P., Donati, F., Merciai, S., Schmidt, J., Rodrigues, J.F.D., & Tukker, A. (2019). The circularity gap of nations: A multiregional analysis of waste generation, recovery, and stock depletion in 2011. Resources, Conservation and Recycling, 151, art. no. 104452.
Ayres, R.U., & Kneese, A.V. (1969). Production, consumption and externalities. American Economic Review, 59(3), pp.282–297.
Baud, S., Kollertisch, E., Milota, E., Petrovic, B., Bruckner, M., Giljum, S., & Lugschitz, B. (2011). Physical input output tables for Austria 2005- Step 1: Physical supply and use tables. Vienna, Statistics Austria and SERI. Eurostat grant agreement number 50304.2009.001-2009.261.
Bikker, R., Daalmans, J., & Mushkudiani, N. (2012). Macro Integration – Data reconciliation. Statistical Methods (201104). Statistics Netherlands, Den Haag/Heerlen, Netherlands.
Blomsma, F., & Brennan, G. (2017). The emergence of circular economy: a new framing around prolonging resource productivity. Journal of Industrial Ecology, 21(3), pp.603-614.
Bringezu, S. (1993). Towards increasing resource productivity: How to measure the total material consumption of regional or national economies. Fresenius Environmental Bulletin, 2(8), pp.437–442.
Bringezu, S., Fischer-Kowalski, M., Kleijn, R., & Palm, V. (1998). Analysis for action: Support for policy towards sustainability by material flow accounting. Proceedings of the Conaccount Conference Sept. 11–12, 1997, Wuppertal. Wuppertal, Germany: Wuppertal Institute.
CBS (2021). National Accounts 2020 tables. [Online] Available at: https://www.cbs.nl/en-gb/custom/2021/27/national-accounts-2020-tables [Accessed: 02/09/2022].
CBS (2022a). Energiebalans; aanbod, omzetting en verbruik. [Online] Available at: https://www.cbs.nl/nl-nl/cijfers/detail/83140NED [Accessed: 02/09/2022].
CBS (2022b). Afvalbalans, afvalsoort naar sector; nationale rekeningen. [Online] Available at: https://opendata.cbs.nl/statline/#/CBS/nl/dataset/83554NED [Accessed: 02/09/2022].
CBS (2022c). Aanvoer, verwerking van afval bij recyclingbedrijven (SBI2008). [Online] Available at: http://opendata.cbs.nl/statline/#/CBS/nl/dataset/81416NED [Accessed: 02/09/2022].
CBS (2022d). Akkerbouwgewassen; voorlopige en definitieve oogstraming. [Online] Available at: http://opendata.cbs.nl/statline/#/CBS/nl/dataset/84296NED [Accessed: 02/09/2022].
Circle Economy (2021). The Circularity Gap Report 2021. [Online] Available at: https://www.circle-economy.com/resources/circularity-gap-report-2021 [Accessed: 10/01/2022].
De Haan, M. (2001). Accounting for goods and for bads – Measuring environmental pressure in a national accounts framework, PhD thesis, Statistics Netherlands, Voorburg/Heerlen.
De Jongh, L., Tunn, V.S.C., Delahaye, R. (2022). Afvalcijfers op een rij [Overview of waste figures]. [Online] Available at: https://www.cbs.nl/nl-nl/longread/diversen/2022/afvalcijfers-op-een-rij [Accessed: 27/07/2022].
European Union (2011). Regulation (EU) No 691/2011 of the European Parliament and of the Council of 6 July 2011 on European environmental economic accounts. Official Journal of the European Union, L 192, Volume 54, 22 July 2011.
European Commission (2021). Circular economy action plan. [Online] Available at: https://ec.europa.eu/environment/strategy/circular-economy-action-plan_en [Accessed: 04/11/2021].
Eurostat (2001a). Economy-wide material flow accounts and derived indicators: A methodological guide. Luxembourg: Eurostat, European Commission, Office for Official Publications of the European Communities.
Eurostat (2001b). Material use indicators for the European Union, 1980–1997: Economy-wide material flow accounts and balances and derived indicators of resource use. Working Paper No. 2/2001/B/2, prepared by S. Bringezu and H. Schütz. Luxembourg: European Commission and Eurostat.
Eurostat (2014). Physical Energy Flow Accounts (PEFA): Manual 2014. [Online] Available at: https://ec.europa.eu/eurostat/documents/1798247/6191537/PEFA-Manual-2014-v20140515.pdf [Accessed: 18/11/2021].
Eurostat (2018). Economy-wide material flows: Handbook. [Online] Available at: b621b8ce-2792-47ff-9d10-067d2b8aac4b (europa.eu) [Accessed: 10/11/2021].
Eurostat (2021). INTRASTAT NET MASS SINCE 2006 — version 2021. [Online] Available at: http://epp.eurostat.ec.europa.eu/newxtweb/downloadobject.do?keepsessionkey=true&filenameOut=INTRASTAT_NET_MASS_SINCE_2006.zip&mimeType=application/zip&objectID=610438034&objectType=LOB&disposition=attachment [Accessed: 02/09/2022].
Eurostat (2022a). Monitoring Framework: Circular Economy Indicators. [Online] Available at: https://ec.europa.eu/eurostat/web/circular-economy/indicators/monitoring-framework [Accessed: 10/01/2022].
Eurostat (2022b). Prodcom - Statistics by products – Overview. [Online] Available at: https://ec.europa.eu/eurostat/web/Prodcom [Accessed: 02/09/2022].
Eurostat (2022c). PHYSICAL ENERGY FLOW ACCOUNTS. [Online] Available at: https://ec.europa.eu/eurostat/web/environment/energy-accounts [Accessed: 02/09/2022].
Eurostat (2022d). Air emissions accounts by NACE Rev. 2 activity. [Online] Available at: https://appsso.eurostat.ec.europa.eu/nui/show.do?dataset=env_ac_ainah_r2&lang=en [Accessed: 02/09/2022].
Eurostat (2022e). Stone's Method (Method). [Online] Available at: https://ec.europa.eu/eurostat/cros/content/stones-method-method_en [Accessed: 04/02/2022].
Fischer-Kowalski, M., Krausmann, F., Giljum, S., Lutter, S., Mayer, A., Bringezu, S., Moriguchi, Y., Schütz, H., Schandl, H., & Weisz, H. (2011). Methodology and indicators of economy-wide material flow accounting: State of the art and reliability across sources (2011) Journal of Industrial Ecology, 15 (6), pp.855-876.
Geng, Y., Fu, J., Sarkis, J., & Xue, B. (2012). Towards a national circular economy indicator system in China: an evaluation and critical analysis. Journal of Cleaner Production, 23(1), pp.216-224.
Gurría, P., Ronzon, T., Tamosiunas, S., López, R., García Condado, S., Guillén, J., Cazzaniga, N. E., Jonsson, R., Banja, M., Fiore, G., & M'Barek, R. (2017). Biomass flows in the European Union: The Sankey Biomass diagram- towards a cross-set integration of biomass, EUR 28565 EN. DOI:10.2760/352412.
Gurría, P., González, H., Ronzon, T., Tamosiunas, S., López, R., García Condado, S., Ronchetti, G., Guillén, J., Banja, M., Fiore, G., M'Barek R. (2020). Biomass flows in the European Union: The EU Biomass Flows tool, version 2020, EUR 30454 EN. Publications Office of the European Union, Luxembourg. DOI: 10.2760/14342.
Hanemaaijer, A., Kishna, M., Kooke, M., Brink, H., Koch, J., Prins, A.G., & Rood, T. (2021). Integrale Circulaire Economie Rapportage 2021. Den Haag: Dutch Environmental Assessment Agency (PBL Planbureau voor de Leefomgeving).
Haupt, M., & Hellweg, S. (2019). Measuring the environmental sustainability of a circular economy. Environmental and Sustainability Indicators, 1-2, 100005.
Helander, H., Petit‐Boix, A., Leipold, S., & Bringezu, S. (2019). How to monitor environmental pressures of a circular economy: An assessment of indicators. Journal of Industrial Ecology, 23(5), pp.1278-1291.
Hiemstra, L. (2014). Processing, production abroad and merchanting in the national accounts. Project and report commissioned by the European Union, Project of Directorate C1, Eurostat, European Commission, Grant Agreement Number 20101.2010.004-2010.213.
Hoekstra, R. (2003). Structural change of the physical economy: Decomposition analysis of physical and hybrid-unit input-output tables, Tinbergen Institute Research Series, No 315, Thela Thesis Academic Publishing Services, Amsterdam.
Hoekstra, R., & van den Bergh, J.C.J.M. (2006). Constructing physical input-output tables for environmental modeling and accounting: Framework and illustrations. Ecological Economics, 59(3), pp. 375–393.
Jacobi, N., Haas, W., Wiedenhofer, D., & Mayer, A. (2018). Providing an economy-wide monitoring framework for the circular economy in Austria: Status quo and challenges. Resources, Conservation and Recycling, 137, pp.156-166.
Japan Environment Agency (1992). Quality of the environment in Japan 1992. Tokyo: Japan Environment Association.
Kardung, M., Cingiz, K., Costenoble, O., Delahaye, R., Heijman,W., Lovri´c, M., van Leeuwen, M., M’Barek, R., van Meijl, H., Piotrowski, S., Ronzon, T., et al. (2021). Development of the Circular Bioeconomy: Drivers and Indicators. Sustainability, 13 (1), 413. https://doi.org/10.3390/su13010413.
Keuning, S.J. (1993). An information system for environmental indicators in relation to the national accounts, In: W.M. de Vries, G.P., de Bakker, M.B.G. Gircours, S.J. Keuning & A. Lenson (eds.) The value of national accounting, Statistics Netherlands, Voorburg/Heerlen.
Kirchherr, J., Reike, D., & Hekkert, M. (2017). Conceptualizing the circular economy: An analysis of 114 definitions. Resources, Conservation and Recycling, 127, pp.221-232.
Konijn, P.J.A., Boer de, S., & Dalen van, J. (1995). Material flows, energy use and the structure of the economy, Occasional paper 77, Statistics Netherlands, Den Haag/Heerlen, Netherlands.
Kovanda, J. (2018). Compilation of physical supply and use tables as a tool for increasing analytical potential of economy-wide material flow analysis and indicators. Statistika 98(3).
Kristensen, H.S., & Mosgaard, M.A. (2020). A review of micro level indicators for a circular economy–moving away from the three dimensions of sustainability?. Journal of Cleaner Production, 243, 118531.
Mäenpää, I. (2005). Waste flows in frameworks of physical input -output tables and material flow accounting, Thule Institute, Statistics Finland, Helsinki, Finland.
Matthews, E., C. Amann, M. Fischer-Kowalski, S. Bringezu, W. Hüttler, R. Kleijn, Y. Moriguchi, et al. (2000). The weight of nations: Material outflows from industrial economies. Washington, DC: World Resources Institute.
Mayer, A., Haas, W., Wiedenhofer, D., Krausmann, F., Nuss, P., & Blengini, G.A. (2019). Measuring progress towards a circular economy: a monitoring framework for economy‐wide material loop closing in the EU28. Journal of Industrial Ecology, 23(1), pp.62-76.
Merciai, S., Schmidt, J.H., Dalgaard, R., Giljum, S. Lutter, S., Usubiaga, A., Acosta J., Schütz, H., Wittmer, D., & Delahaye, R. (2014). CREEA — Report and data Task 4.2: P-SUT.
Merciai, S., & Schmidt, J. (2018). Methodology for the Construction of Global Multi-Regional Hybrid Supply and Use Tables for the EXIOBASE v3 Database. Journal of Industrial Ecology, 22 (3), pp.516-531.
Moll, S., & Acosta, J. (2006). Environmental implications of resource use: Environmental input-output analyses for Germany. Journal of Industrial Ecology, 10(3), pp.25-40.
Moraga, G., Huysveld, S., Mathieux, F., Blengini, G.A., Alaerts, L., Van Acker, K., De Meester, S., & Dewulf, J. (2019). Circular economy indicators: What do they measure?. Resources, Conservation and Recycling, 146, pp.452-461.
Moriguchi, Y. (2007). Material flow indicators to measure progress toward a sound material-cycle society. Journal of Material Cycles and Waste Management, 9(2), pp.112-120.
Nattrass, L., Biggs, C., Bauen, A., Parisi, C., Rodríguez-Cerezo, E., & Gómez-Barbero, M. (2016). The EU bio-based industry: results from a survey. Institute for Prospective and Technological Studies, Joint Research Centre, European Commission.
OECD (2008). Measuring material flows and resource productivity: Volume 1. The OECD guide. Paris: OECD.
Pedersen, O.G. (1999). Physical input-output tables for Denmark: Products and materials 1990. Air emissions 1990–92. Copenhagen, Denmark: Statistics Denmark.
Pedersen, O.G. (2004). Waste accounts for Denmark 1999, Statistics Denmark, Copenhagen, Denmark.
Pedersen, O.G., & Deveci, N.N. (2014). Construction of physical supply-use and input-output tables for Denmark, Copenhagen, Statistics Denmark, Eurostat grant argreement 50904.2012.004-2012.432.
Rijksoverheid (2016). Nederland circulair in 2050. [Online] Available at: https://www.rijksoverheid.nl/onderwerpen/circulaire-economie/nederland-circulair-in-2050 [Accessed: 04/11/2021].
SITRA (2016). Leading the cycle – Finnish road map to a circular economy 2016–2025. [Online] Available at: https://media.sitra.fi/2017/02/28142644/Selvityksia121.pdf [Accessed: 04/11/2021].
Saidani, M., Yannou, B., Leroy, Y., Cluzel, F., Kendall, A. (2019). A taxonomy of circular economy indicators. Journal of Cleaner Production, 207, pp.542-559.
Statistics Denmark (undated). Detailed material flow accounts (physical supply-use tables) https://www.dst.dk/en/Statistik/dokumentation/documentationofstatistics/detailed-material-flow-accounts--physical-supply-use-tables- [Accessed: 08/02/2022].
Steurer, A. (1992). Stoffstrombilanz Österreich 1988. [Material flow balance for Austria 1988.] Social ecology working paper 26. Vienna, Austria: IFF Social Ecology.
UN (2009). System of National Accounts 2008. [Online] Available at: https://unstats.un.org/unsd/nationalaccount/docs/sna2008.pdf [Accessed: 30/11/2021].
UN (2014). System of Environmental-Economic Accounting 2012: Central Framework. [Online] Available at: https://unstats.un.org/unsd/envaccounting/seearev/seea_cf_final_en.pdf [Accessed: 16/11/2021].
UNECE (2021). Circular economy. [Online] Available at: https://unece.org/trade/CircularEconomy [Accessed: 04/11/2021].
Van Berkel, J.& Delahaye, R. (2019). Material Flow Monitor 2016 - technical report. Statistics Netherlands. Available at: https://www.cbs.nl/-/media/_pdf/2019/10/material-flow-monitor-2016-cbs---technical-report.pdf [Accessed: 10/03/2022].
Weisz, H., & F. Duchin. (2006). Physical and monetary input-output analysis: What makes the difference? Ecological Economics, 57(3), pp.534–541.
Wiedmann, T.O., Schandl, H., Lenzen, M., Moran, D., Suh, S., West, J., & Kanemoto, K. (2015). The material footprint of nations. Proceedings of the National Academy of Sciences of the United States of America, 112 (20), pp.6271-6276.
Yuan, Z., Bi, J., & Moriguichi, Y. (2006). The circular economy: A new development strategy in China. Journal of Industrial Ecology, 10(1‐2), pp.4-8.