4. Case study: measuring the bio-based economy with the Material Flow Monitor
The MFM is used as the basis to calculate a range of circular economy indicators such as resource efficiency, dependency and substitution (see Hanemaaijer et al., 2021). These indicators are compiled at national and sector level. Substitution can occur between primary and secondary resources but also between abiotic and biotic resources. Replacing abiotic resources with biotic resources is also a CE transition strategy, and the MFM can be used to measure the bio-based economy. The MFM allocates products and materials to different material categories – biomass, fossil, metals and minerals – based on largest material content. Thus, many products in a particular category also contain other materials. For example, cars are allocated to ‘metal’ although they also contain plastic and rubber. Similarly, diesel and petrol are allocated to ‘fossil’ while they contain a small share of bio-based fuel. As the bio-based shares of such products are not evident from the MFM, this part of the bio-based economy is not covered.The following case study demonstrates how the MFM can be extended in order to measure the bio-based economy in the Netherlands, and showcases the potential and the limitations of the MFM.
4.1 Approach
The method used to extend the MFM so that it captures the bio-based economy better, was first developed in the European Horizon 2020 BioMonitor project (see https://biomonitor.eu) and subsequently improved as part of the Dutch Work Programme Monitoring and Steering Circular Economy 2019–2023 (Hanemaaijer et al., 2021).We distinguish between the bio-economy and the bio-based economy. “The Bioeconomy encompasses the production of renewable biological resources and their conversion into food, feed, bio-based products and bioenergy.” (Nattrass et al., 2016, p.15). Renewable biological resources comprise products obtained from agriculture, forestry and fishery. For the sake of brevity, here renewable biological resources are referred to as biotic materials. The bio-based economy is a subset of the bio-economy and encompasses the conversion of biotic materials into bio-based materials, products, fuels and energy sources. Below we call these bio-based materials.
To monitor the bio-based economy, the MFM tables are first converted to dry matter and then extended by applying bio-based coefficients to the products. Coefficients to convert products to dry matter were taken from Gurría et al. (2017) and Merciai et al. (2014). The coefficients for the bio-based content of goods were estimated by the NOVA institute as part of the BioMonitor project. The bio-based coefficients were developed for goods in the Prodcom list of goods and services (see section 3.2.1 for more information about Prodcom). By linking the Prodcom classification of goods with the MFM classification of goods, it is possible to estimate the bio-based share of the MFM. The coefficients were used to divide plastics and other relevant product categories into biotic and abiotic shares, resulting in separate supply and use tables for biotic and abiotic materials. The supply and use tables for both biotic and abiotic materials had to be balanced again for each good and each sector. Based on the extended MFM, several indicators were explored: biotic and bio-based production, substitution, cascading and use of secondary biotic materials in the Netherlands. These indicators were subsequently validated during an online workshop with nine bio(-based) economy experts from policymaking, academia, and industry.
4.2 Findings
This section discusses the findings for each indicator and provides the key insights from the expert workshop.
4.2.1 Biotic and bio-based production
The production of biotic and bio-based products can be used as an indicator to estimate the size of the bio-based economy. To obtain this indicator, we labelled the MFM product categories that met the above stated definitions of the bio-economy and bio-based economy as biotic and bio-based. We then used the supply table of the MFM to calculate the biotic and bio-based share of the total production. Notice, however, that adding up all sectors leads to double counting as the output of one sector is the input of another. In terms of weight, only 19% of Dutch production is part of the bio-economy and only 6% part of the bio-based economy. The outcomes are presented in Table 3 below.
| Production | kilotons | percent |
|---|---|---|
| Abiotic production | 251,064 | 81% |
| Biotic production (includes bio-based production) | 57,854 | 19% |
| Bio-based production | 17,076 | 6% |
| Total production | 308,918 | 100% |
To validate these indicators we compared them with previous research. Gurría et al. (2020) analysed biomass flows in Europe with Eurostat data. They report a supply of biomass of approximately 49 billion kilo in the Netherlands in 2017. Given the uncertainty of the figures, this can be considered within the same range as the 57.9 billion kilo biotic production we found (see Table 3). However, there is a large discrepancy in the bio-based production; we found 17 billion kilo while Gurría et al. (2020) reported 4.5 billion kilo supply of biomass not used for feed and food. This discrepancy is likely a result of the bio-based shares we applied to composite products. This different scope of bio-based production can also partly explain the difference in total reported biomass.
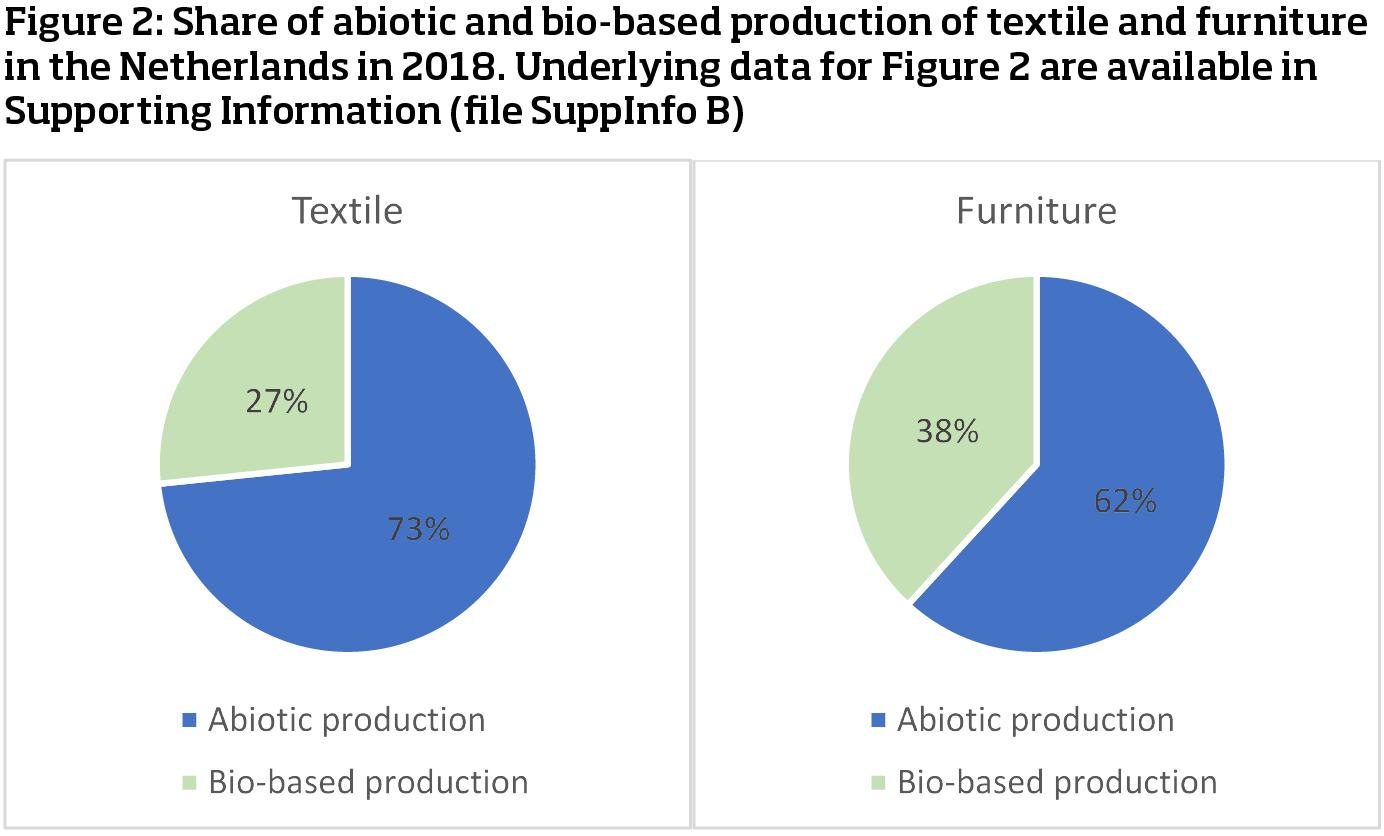
The extended MFM can also be used to derive indicators for sectors’ bio-based production. For example, textiles produced in the Netherlands are 27% bio-based, while 38% of furniture is bio-based (see Figure 2). Within textiles, carpets account for the largest volume of bio-based material, for furniture this is office furniture.
The production indicator is useful to show the share of biotic and bio-based production of the economy and of aggregated sectors. It shows clearly that until now only a small part of production in the Netherlands uses bio-based materials. This finding did not spark a discussion during the expert workshop. Due to the high level of aggregation, the indicator is probably not suitable for annual monitoring, as small developments would not be visible. It might show progress after five or ten years if there are major shifts towards bio-based production in the Netherlands; however, for this purpose country-specific bio-based shares need to be developed and periodically updated. Another option is to monitor sectors that have a high potential for a bio-based transition. We recommend validating the reliability of indicators at sector level by sector experts.
4.2.2 Use of biotic residuals
In the bio-based economy, biotic residuals are reused as much as possible. The extended MFM can be used to determine in which economic sectors biotic waste and recycled biotic materials are used. For this indicator, we do not distinguish between residuals from biotic materials and bio-based materials and refer to them as biotic residuals. To explore this indicator, the biotic use table of the extended MFM for 2018 is used. The MFM does not include residuals that are reused within an organization. For example, manure produced and used as fertilizer on the same farm is not recorded.
According to the extended MFM, 12,095 kilotons of biotic residuals were reused in the Netherlands in 2018. To gain more insight into the use of the biotic residuals we clustered the sectors in four groups.
1. industry: all manufacturing, e.g., textile, chemical and pharma
2. food sector
3. agricultural sector: livestock and plant cultivation
4. generation of energy.
Nearly one third of biotic residuals are used for energy generation, just under a third by industry and a quarter are used in agriculture. Details are provided in the table below. The numbers give an order of magnitude for the reuse of biotic residuals in different sectors but require further validation.
| Reuse of biotic residuals | kilotons | percent |
|---|---|---|
| Industry | 3,462 | 29% |
| Food and feed | 1,817 | 15% |
| Agriculture | 2,993 | 25% |
| Energy generation | 3,823 | 32% |
| Total reused biotic residuals | 12,095 | 100% |
4.3 Case study conclusions and recommendations
The indicators derived from the extended MFM show that the bio- and bio-based economy in the Netherlands is still relatively small compared to other material flows. The case study also illustrates how data from the MFM can be used to reveal connections between different sectors, for example how biotic residuals are reused in other sectors. This macro-economic perspective captures the overall trends of biotic material supply and use. Overall, the extended MFM is useful to establish a baseline for the bio-based economy. The method can be further improved for monitoring, aided by the addition of more bio-based materials and products to statistical classifications in the future, which will help to monitor the developments more precisely.
The case study demonstrates how the MFM can be used to develop macro-economic material flow indicators. Developments in one sector can be placed in the context of the entire economy to determine the order of magnitude of a trend. In addition, the close link between the MFM and the national accounts makes it easier to develop related economic indicators such as value added and employment in the bio-based economy. The aggregated data of the MFM are quite robust as they are the result of the confrontation of several data sources and because the figures are checked at an aggregated level. The case study illustrates that data from the MFM at a very detailed level need to be checked thoroughly as they might not be sufficiently reliable to derive developments over time. This is because different statistical datasets are integrated that each have an uncertainty margin, in addition, assumptions have to be made to compile the MFM figures and judgement calls are necessary to reconcile the supply and use data.