Imports of Digitised Products
About this publication
The term ‘Digitised products and services’ covers a wide spectrum of activities within the present economic landscape. Because this spectrum is so wide and sometimes a bit vague, we needed to look into literature and best practices to determine if activities fall within the scope and which do not. Furthermore, many of the statistics available today and the different categories they recognise are not yet well suited for distinguishing between ‘regular’ offline economic activities and their more ‘digital’ counterparts.
This new reality of direct (or semi-direct via a platform) digitised service transfers to and from enterprises or consumers, regardless of their locations, provides new challenges to statisticians. Statistics Netherlands has conducted several projects over the last few years to improve the estimates for these digitised services. For the 2010 revision, estimates for several types of digitised services were implemented in the national accounts. The 2015 revision saw an update and expansion of those estimates, which were also included in the international trade in services statistics. The objective of this project is to create better estimates for the import of digitised services for the 2021 revision of the national accounts; to be published in 2023.
1. Introduction and background
Today's globalisation is taking place on many levels. Our politics, economy, defence, culture, ecology and social life are increasingly intertwined with residents of other countries around the world. The ability to communicate and organise globally without distance playing a limiting role has brought the world closer together.
This "proximity" is also reflected in international trade. The export of goods and services in the Netherlands has tripled within 20 years. This growth is slightly stronger for services (301 percent) than for goods (267 percent). Whereas in 1995, Dutch service exports accounted for one-fifth of total exports, in 2017 the share of Dutch service exports had increased to a quarter. Service exports in the Netherlands also proved to be resistant to the 2009 economic crisis; whereas goods trade fell by 17 percent, service exports remained stable. Dutch service exports have grown faster than goods exports, especially over the past decade. Since 2012, the export of services from the Netherlands has increased 67 percent compared to a 37 percent increase in the export of goods (CBS, 2020a). International trade in services accounts for more than 11 percent of the Dutch GDP. This share has increased in recent years, while the importance of trade in goods has remained stable (Lemmers, 2015).
There are several reasons why international trade in services is rising. One is that companies have found other ways to produce. In the past, a company produced where it was located and sold its products in its vicinity. In the traditional division of labour, a producer looks for locations with the most favourable mix of availability of cheap labour, qualified labour, raw materials and capital. Because it has become relatively easy to organise and integrate production processes in geographically distant places, production is cut even further. Nowadays, companies are increasingly looking for the best location for parts of the production process. On the one hand, this increase is a result of the direct transfer of services in the production chain abroad, such as accountants, controllers and HR managers. Furthermore, the coordination of other activities such as IT and help desk functions are increasingly shifted out of the company’s home country (Vos & Loog, 2018). On the other hand, the fragmentation of the production of goods also boosts trade in services due to an increased need for transport of (semi-finished) products and because companies increasingly have their own production carried out abroad under their own management. The goods are only processed, not sold, which results in trade in services instead of goods. And even in regular production we see more and more that companies lease their machines rather than buying them, which is again a trade in services (NVL, 2018).
In recent years we not only see an increase in international services being acquired by companies, but also by consumers. As most services do not need a physical global distribution channel, they lend themselves perfectly to direct online purchase from the worldwide vendor. This means that service providers can sell to the world by just opening a website or creating an app. Multiple new digital giants such as Booking.com, Airbnb and Uber have optimised this business model by creating platforms targeted at consumers who can find large numbers of service providers in one digital location.
This new reality of direct (or semi-direct via a platform) digitised service transfers to and from enterprises or consumers, regardless of their locations, provides new challenges to statisticians. These digitised services are being sold and acquired worldwide, but generally not by the standard of well-monitored large-sized enterprises. The services are provided by smaller enterprises or even consumers. Even if they sell their services via platforms, they are often located somewhere else in the world and tend to have few employees. These services are for the largest part bought by consumers or small enterprises, which are scarcely monitored. This means that we can expect to have problems monitoring digitised services.
We live undisputedly in a very unique time. Disruptive inference of COVID-19 has changed our lives and hit the global economy. The coronavirus crisis has also affected international trade in services. In the second quarter of 2020, Dutch exports of services amounted to 52.8 billion euros. That is 12 percent lower than in the same period in 2019. Dutch imports of services fell by 17 percent. This is an unprecedented contraction of the international trade in services (CBS, 2020b).
As a result of the coronavirus crisis over the past months, we have been living in an even more digital society than ever before. The digital transformation has inevitably been accelerated by the COVID-19 pandemic, which can be observed in the Dutch trade in services in the second quarter of 2020. There were certainly companies that saw their international trade in services increase significantly. For example, the increase in online spending in the Netherlands resulted in turnover growth for online payment platforms. Also, Dutch exports of intellectual property grew by 13 percent as companies that support digital activities such as streaming of films and music have seen their imports and exports increase (CBS,2017a). The availability of data on digitalised products will also provide useful insight into the current impact of COVID-19 on the digital transformation of society.
Statistics Netherlands has conducted several projects over the last few years to improve the estimates for these digitised services. For the 2010 revision, estimates for several types of digitised services were implemented in the national accounts. The 2015 revision saw an update and expansion of those estimates, which were also included in the international trade in services statistics. The objective of this project is to create better estimates for the import of digitised services for the 2021 revision of the national accounts; to be published in 2023. More precisely, this means that we are going to focus on estimating the size of the import of six different types of digitised services for a time series on 2010-2016.
- Dwelling services due to digital intermediation (intermediation via Airbnb), imports
- Digital intermediation services of hotel services (such as Booking.com), imports
- Upscaling taxi services due to digital intermediation (such as Uber.com), imports
- Digital intermediation of travel (not taxi) services, imports
- Imports of database services and database originals
- Imports of goods via e-commerce as a sales channel
2. Conceptual framework for measuring trade in digitised products
The scope of this study is quite broad. We will look into digital intermediation itself but also certain specific activities facilitated by digital intermediation. We will better examine the estimations for characteristic digital products such as database services, but sale of goods via e-commerce is also in scope of this study.
Wat is digital trade?
Digital trade, of course, is not completely new. As digitally enabled transactions in the purchase of goods and services alike have been part of the economic reality for decades. The issues raised by these digitally enabled transactions are the same or similar to those raised by non-digital transactions. This is because digital trade is not just about digitally delivered services, it is much broader. The increase in digital trade has effect on or is a result of changes in the entire supply chain of goods and services due to growing digital connectivity.
Digital trade is all trade that is digitally ordered and/or digitally delivered (OECD, 2019a).
Due to the scale of transactions and the emergence of new (and often disruptive) players and business models, production processes and industries are being transformed. The scope of this transformation transcends the industries that were previously affected by globalisation (OECD, 2019b). Following the methodological guidance of the OECD “Handbook on Measuring digital trade” (see Figure 2.1 below) we try to supplement the knowledge on these transformations by looking into several goods and services that are digitally ordered and digitally delivered.
2.1 The conceptual framework for digital trade
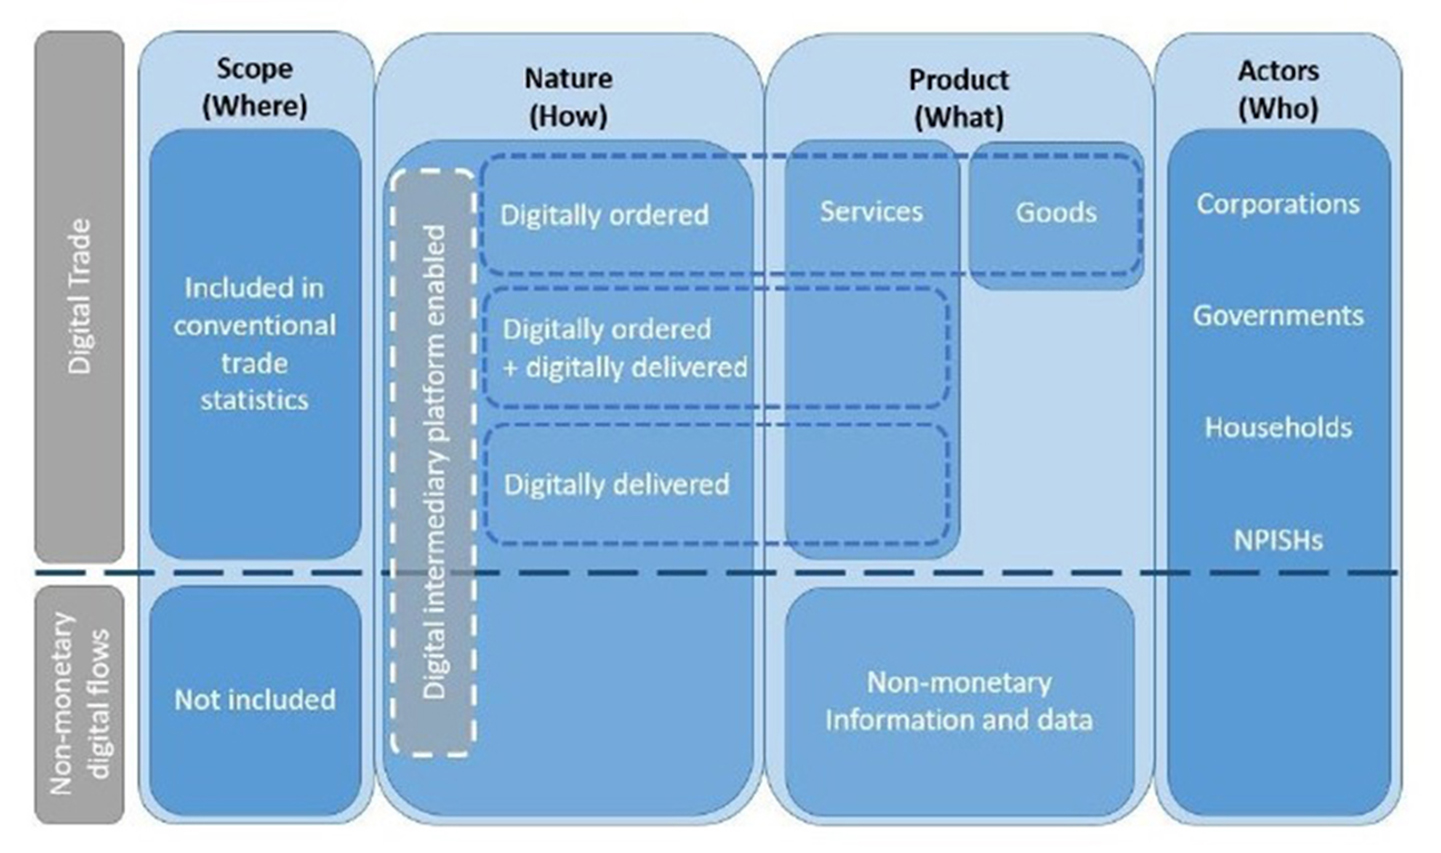
Source: OECD
Digital intermediation
One of the eye-catching new business models due to increased digitalisation are online platforms. These days they are dominantly present in the market and are significantly influencing our economy. The era of so-called “Digital Disruptive Intermediaries” (DDI) has begun. In their research, Riemer et al. (2015) state that “DDIs approach markets as a matter of information management rather than traditional resource deployment and exploitation”. Information is key. To be successful, online platforms have to use and organise the user’s data to increase their profit from supply of services. Following the classification of the DDI presented in the research done by Riemer et al. (2015), digital intermediaries like Uber and Airbnb belong to intermediaries which match supply and demand by pairing customers with the right suppliers of products, content or services, often by way of specialised algorithms. Because their impact on the local and international market shakes the existing market allocation mechanisms, such online platforms were defined by Riemer et al. (2015) as disruptive matchers.
Industries where matching was not organised effectively or efficiently previously, are a perfect breeding ground for these disruptive matchers. These might be industries with monopolised distribution channels. Airbnb is a prominent example. They only have 1.7 percent of the employee size of Marriott International, the world’s largest hotel chain, but more listed properties than the top five global hotel brands combined (Hartmans, 2017). By collecting the data on their users/visitors, online platforms can significantly increase their benefits. They can monetise this data by conducting analytical researches and selling or licensing the use of data to third parties. The Handbook on measuring digital trade (OECD, 2019a) defines intermediation fees that DIP (Digital Intermediation Platforms) accounts for the matching of customers and suppliers as:
Online fee-based intermediation services that enable transactions between multiple buyers and multiple sellers, without the intermediation platform taking economic ownership of the goods or rendering services that are being sold (intermediated).
The effect of the appearance of new, web-based intermediaries in the corporate sector is a clear shift of intermediation revenues and value added income from e.g. a travel agent (the traditional provider) to e.g. Booking.com (a web-based provider). These activities should be recorded in the national accounts via recording in the administrative register of the institution. This is certainly done for large-scale players and those that engage in transactions with other corporations. It is important to clarify that not the value of the transacted service itself (such as accommodation fees for hotel rooms or private accommodation rentals) is reported here. Only the margins or service fees charged for the intermediation are subject to recording in a register (Ahmad & Schreyer, 2016).
Due to the business model of online intermediaries, consumers benefit by having more price transparency and more choice as well as more insights in new products (innovation), save time and profit from the availability of free services. The research of Thelle et al. (2015) published by Copenhagen Economics, presented the consumption advantages of the digital intermediation platforms.
2.2 Consumption benefits from online intermediaries
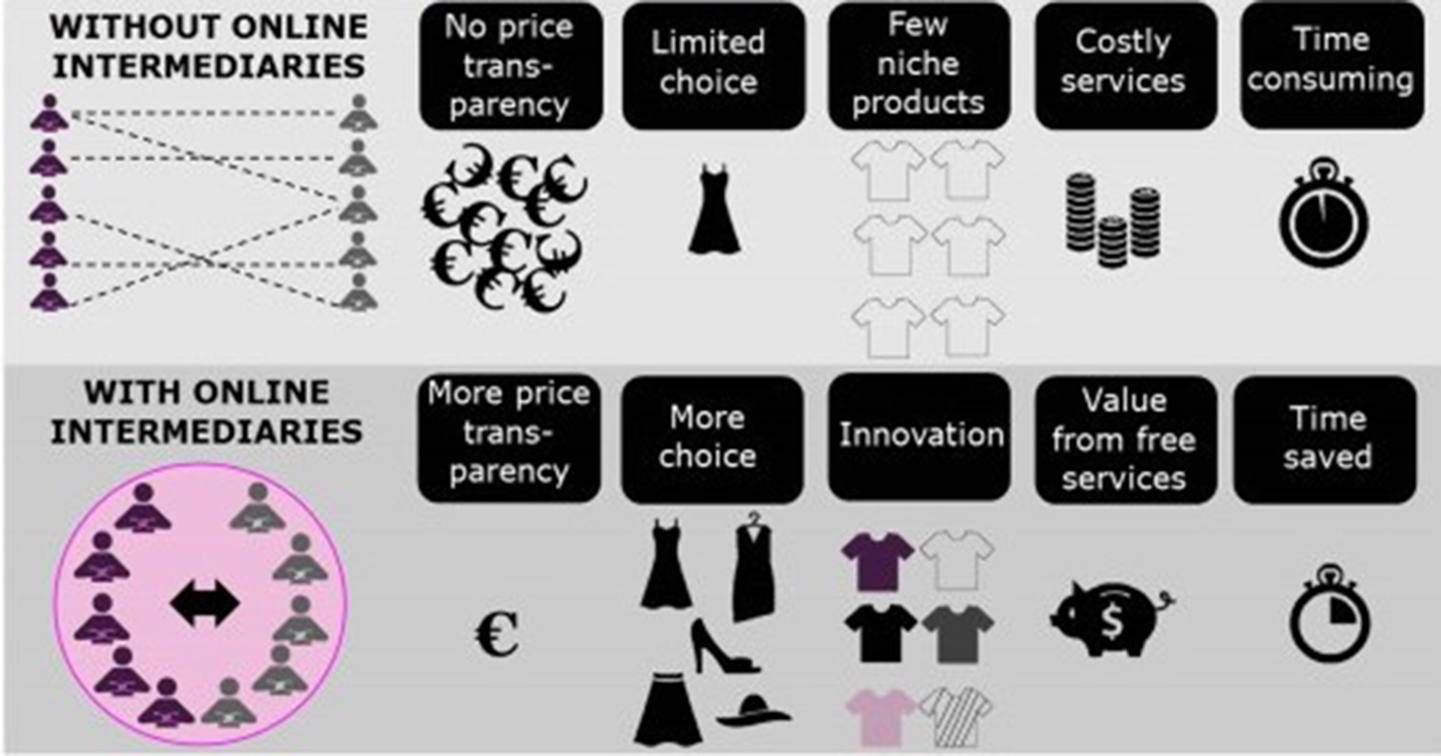
Source: Copenhagen Economics
Digital intermediation of taxi services
Ride sharing and ride-hailing have been made available to a wider audience via high rates of adoption of internet services, smartphones with global navigation systems, online payment technologies, and advanced algorithms. Multi-sided platform business models are used by these services to attract both drivers and passengers. Communication, payment and feedback between the passengers and professional or non-professional drivers is enhanced via ride-sourcing services. Information is given to a passenger once a passenger specifies a destination. It concerns information about the possible route, estimated duration of the trip, the estimated or finalised price calculated by a dynamic pricing algorithm and the driver’s rating (OECD, 2018).
Ride-sharing companies have differentiated their service models to fulfil the requirements of various user groups, targeting high-end, mid-market and budget users separately. Uber, the largest ride-sharing platform globally, offers premium services through its service offerings such as Uber Black, Black SUVs and Uber Select. These services have specific characteristics, such as the use of high-end black cars and professional drivers and target the high net worth individuals and business customers.
Similarly, Lyft has premium brands (Lyft Lux, Lux Black and Lux Black XL). A driver with a qualifying vehicle can list his/her vehicle under those brands. As a consequence, the driver has the opportunity to gain a higher income. For the mid-market Uber has UberX and UberXL by which you can get an everyday ride at an affordable cost. Also, Lyft targets the mid-market through two brands: Lyft and Lyft XL. Again affordable prices targeting regular customers that are seeking convenience. Budget customers are also targeted by Uber and Lyft by the brands UberPool and Lyft Shared respectively. To reduce costs and be able to offer a cheaper rate to each customer, drivers cater to multiple customers at the same time that are sharing destinations close to each other (DBS, 2019).
2.3 Major ride-shares around the globe

Source: Mapchart, DBS
Database services
The world’s most valuable resource is no longer oil, but data (The Economist, print edition 6th May 2017).
Our life becomes more and more driven by data. Recent years have seen an explosion in the generation of data, and the use of this data (e.g. organised in databases) in, for example, advertising-based business models. Managing the process of collection, aggregation, storage and analysis of data for the purpose of successful operation of business became one of the important parts of the daily activity of enterprises. However, because data is typically acquired for free, large parts of it (except those exchanges that are supported by an explicit payment, generally bundled in a different product) are de facto invisible in official statistics (except those exchanges that are supported by an explicit payment, generally bundled in a different product). Social networking sites such as Facebook, or search engines such as Google, offer "free" services to users in exchange for data that can be used by these firms to generate targeted advertising, and hence revenues (Nakamura et al., 2016).
2.4 The global data value cycle
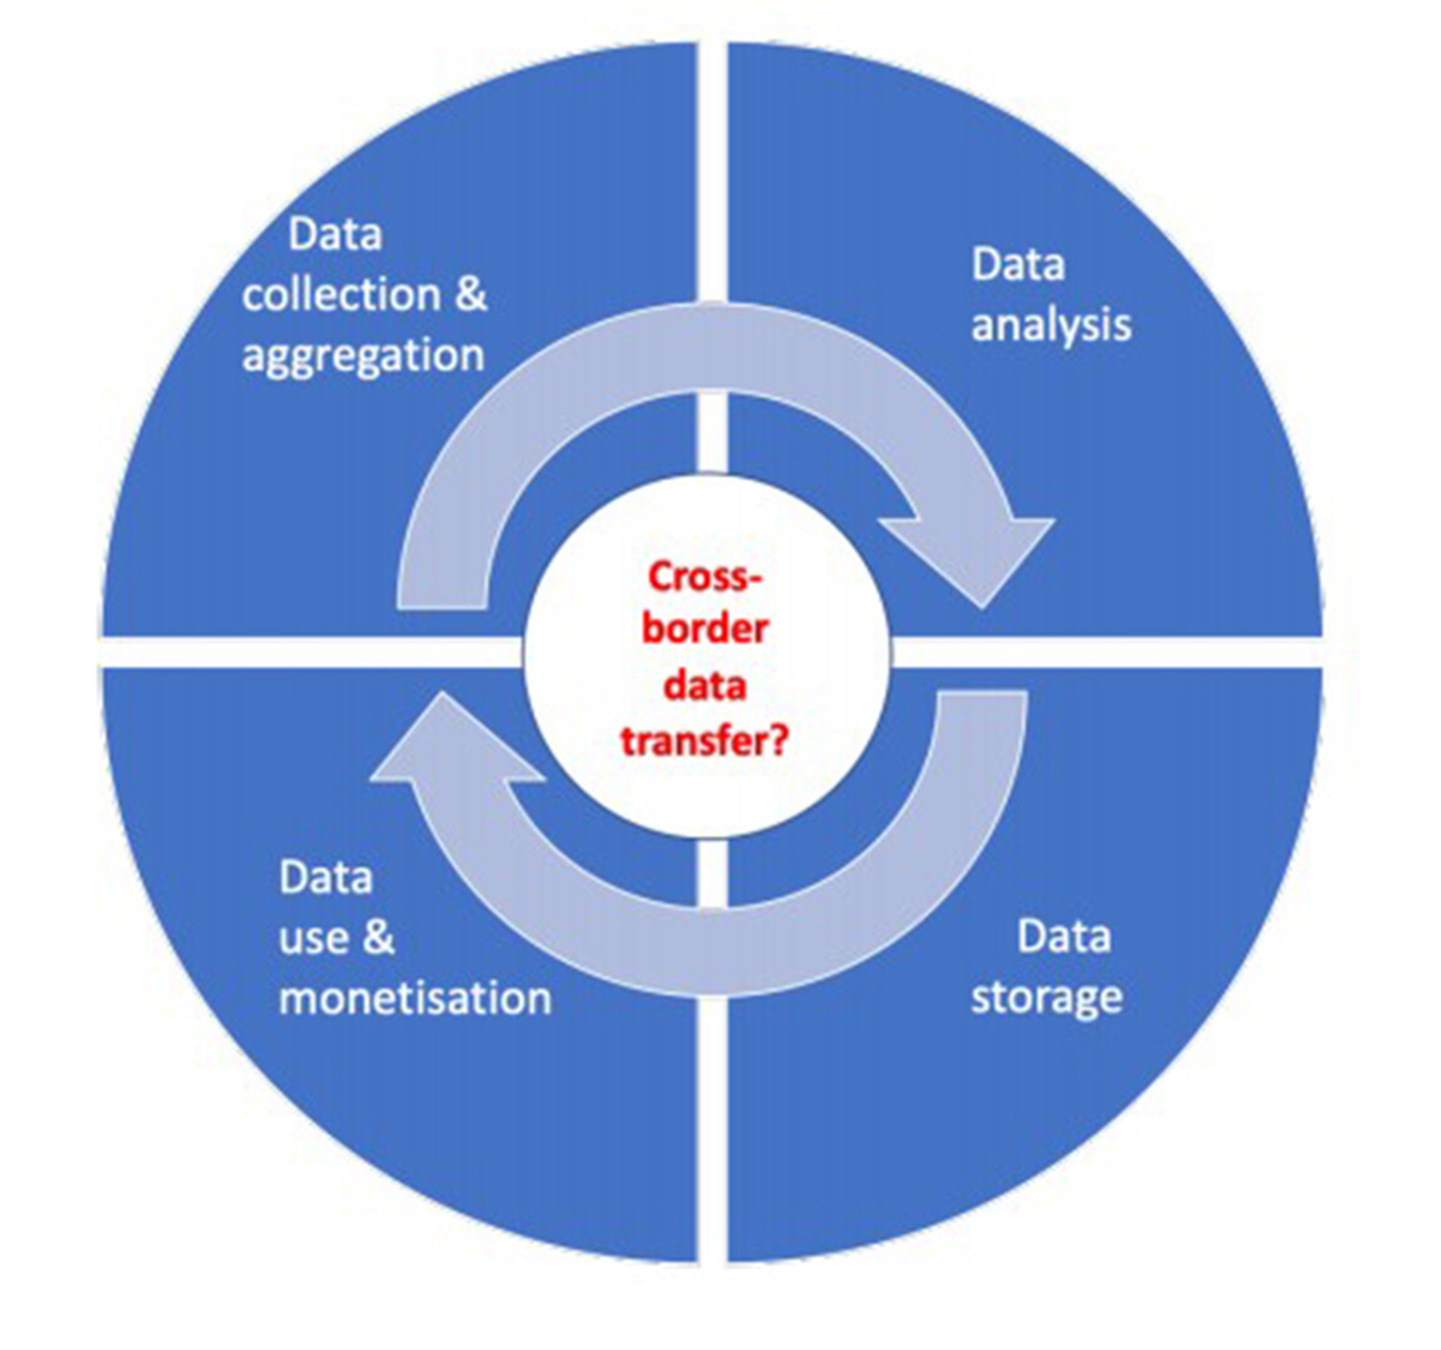
Source: Nguyen & Paczos (2020)
Visconti (2019) define the data value chain by the following five stages: data creation and collection, data storage, data processing (data fusion and analytics), consumption (data visualisation and sharing), and monetisation (business model).
The SNA (OECD, IMF, Eurostat, 2008) provides a definition of databases that refers to data, without however, specifying what data is: databases consist of files of data organised in such a way as to permit resource-effective access and use of the data. Databases may be developed exclusively for own use or for sale as an entity or for sale by means of a licence to access the information contained.
Within the scope of this research, we apply the EBOPS definition of database services as: database conception, data storage, and the dissemination of data and databases (including directories and mailing lists), both online and through magnetic, optical or printed media and web search portals (encompassing search engine services that find Internet addresses for clients who input keyword queries). The CPC also designates a subcategory of databases as “original compilations of facts or information organised for retrieval and consultation, including mailing lists. These compilations are protectable in their presentation, but not their content”.
It is important to stress that cross-border transactions for data, such as software, cloud services, data storage etc. are of course already included in measures of international trade. In addition to these transactions, the transfer of property rights in respect of the above-mentioned products has also been measured within the framework of statistics on international trade in services. In addition to these transactions, the transfer of ownership rights with respect to above-mentioned products, also has to be measured under international trade in services statistics.
E-commerce
From the way we network, to the way we get our news – we are slowly but surely moving everything online. It does not come to a surprise that shopping is no exception.
In the past few decades, online shopping has gone from being non-existent to becoming a multibillion-dollar industry. Buying things online has become common practice among millions of people around the world. Recently the number of people buying goods and services online has increased more than ever before.
One of the reasons why online shopping has grown so much over the years is because of the experience that businesses are able to provide to their customers. We are constantly seeing businesses add new features and services for online shoppers, with the intent of providing them the same support and comfort that they would have during an in-person shopping experience.
Websites are the best-known form of e-commerce for companies which sell products online. Many consumers nowadays shop online, but companies can also be frequent customers of web shops. Even if the buyer does not pay electronically, sales via a website fall under e-commerce. It also does not matter which device a buyer uses to place his order: a desktop, laptop, tablet or smartphone. Consumers can also trade among themselves via websites. This type of e-commerce (C2C) is not measured in this research. In our research we focus on B2B and B2C e-commerce. A less well-known form of e-commerce runs via EDI: Electronic Data Interchange. This form only occurs in trade between companies. Business systems communicate with each other via EDI messages. This type of e-commerce is also taken into account in our research.
The OECD defines an e-commerce transaction as ‘the sale or purchase of goods or services, conducted over computer networks by methods specifically designed for the purpose of receiving or placing of orders. The goods or services are ordered by those methods, but the payment and the ultimate delivery of the goods or services do not have to be conducted online’ (OECD, 2011).
In 2013, more than one out of five Dutch companies sold electronically and more than half of them made purchases via e-commerce. Sales via a website are more common for Dutch businesses than sales via EDI. It seems that, over the years, online purchases and sales of Dutch companies have remained stable. In 2016, 26 percent of Dutch companies sold via e-commerce and 57 percent of them have reported online purchases of goods and services.
Both Dutch companies and Dutch consumers appear to have the same shopping pattern: they prefer to buy within their own country rather than abroad. In 2016, an average company bought for 92 percent of its web purchase value within the Netherlands. The remaining 8 percent of this amount refers to purchases from foreign companies: 6 percent from suppliers within the EU and 2 percent from online suppliers outside the EU (CBS, 2015). Dutch consumers followed the pattern of Dutch businesses. In 2016, only 7 percent of Dutch consumers bought online goods or services at foreign web shops (CBS, 2019). This trend was proven by OECD research (2014) which showed that in a majority of countries participated in the OECD investigation, the percentage of the enterprises that engaged in electronic sales in their own country was much higher than those who carried out cross-border e-sales.
3. Digital imports: methods and results
3.1 Dwelling services due to digital intermediation
Import of dwelling services due to digital intermediation is currently a part of travel measured in the international trade in services statistics. To compile an estimate of the import of dwelling services through digital intermediation we created a model with several assumptions. We assume that:
- Dutch residents only rent from foreigners when they stay abroad.
- Business travellers do not stay in Airbnb’s.
- In the period 2010-2016, Airbnb was the market leader in dwelling services due to digital intermediation. We assume only calculating the imports due to Airbnb is sufficient for estimating the dwelling services imported due to digital intermediation.
Our research has led to the following additional information:
- We found partial market shares of Airbnb in the total lodging for Amsterdam (Colliers, 2017), US (Molla, 2019) and Europe (Kookie, 2019) in different sources. We found more sources than shown below, but most were in line with these numbers. There are some differences between the market shares of Europe and the US, but that seems logical as Airbnb started in the US. We compiled the below market share of Airbnb in the lodging of Dutch tourists abroad based on the market share of Europe as that is the destination for 80 percent of Dutch travel. The 2016 market share is estimated by taking both the doubling of the number of arrivals (Leonardo, 2019) as well as the doubling of the Amsterdam market share as leading.
| Units of measure | 2010 | 2011 | 2012 | 2013 | 2014 | 2015 | 2016 | |
|---|---|---|---|---|---|---|---|---|
| Market share Amsterdam | % | 5.4 | 10.7 | |||||
| Market share Europe | % | 0.6 | 1.8 | 3.0 | 6.6 | |||
| Market share US | % | 3.0 | 5.0 | 9.0 | 13.0 | |||
| Number of arrivals worldwide | millions | 0.14 | 0.8 | 3 | 6 | 16 | 40 | 80 |
| Used market share for Dutch travellers abroad | % | 0 | 0.1 | 0.6 | 1.8 | 3.0 | 6.6 | 13.0 |
- To determine the part of the payment which is reserved for the dwelling service and the part paid as a fee for the intermediation, we need to know what percentage of a booking is paid to Airbnb. There are some different terms and conditions possible, but in general 18 percent (Airbnb, 2020) of the total paid amount is for the intermediation by Airbnb.
- We use information from the Continuous Holiday Survey conducted among Dutch households to make estimates of the amounts they spend on travel. From 2015 onwards, this survey contains information on the amount paid for the accommodation and the type of accommodation travellers stayed in. For previous years we only have the total amount spent on the holiday. For 2015 and 2016, we calculated the amount spent on accommodations (hotels, B&Bs, privately owned houses, apartments and motels) per quarter set off against the total amount spent on the holiday. The ratios proved very stable between both years at 33 percent, 24 percent, 22 percent and 28 percent of the total. These ratios were then used on the totals spent on the holiday per quarter for the previous years. This results in a slowly increasing time series of total Dutch spending on accommodations abroad of around 3 billion euros.
Using this additional information we created an estimate for the dwelling services due to digital intermediation of Airbnb which consists of the revenue of foreign Airbnb vendors from Dutch travellers. This revenue started in 2011 with 2 million euros and quickly rose to 341 million euros in 2016.
| Units of measure | 2010 | 2011 | 2012 | 2013 | 2014 | 2015 | 2016 | |
|---|---|---|---|---|---|---|---|---|
| Used market share for Dutch travellers abroad | % | 0 | 0.1 | 0.6 | 1.8 | 3.0 | 6.6 | 13.0 |
| Total spending of Dutch travellers on accommodations abroad | millions | 2,892 | 2,965 | 3,191 | 3,147 | 3,092 | 3,15 | 3,224 |
| Spending of Dutch travelers on Airbnb accommodations abroad | millions | 0 | 3 | 19 | 57 | 93 | 208 | 419 |
| Airbnb commission (18%) | millions | 0 | 1 | 3 | 11 | 17 | 39 | 78 |
| Revenue of foreign Airbnb vendors from Dutch travellers | millions | 0 | 2 | 16 | 46 | 76 | 169 | 341 |
3.2 Digital intermediation services of hotel services
The import of digital intermediation services of hotel services is currently a part of travel measured in the international trade in services statistics. To compile an estimate of the import of hotel services via digital intermediation we created a model with several assumptions.
We assume that:
- Business travellers do not book their stays via online platforms based outside the Netherlands.
- The market leaders for digital intermediation of hotel services in Europe are Booking.com and Expedia with close to 90 percent of the market (HOTREC, 2020). We assume that other hotel services platforms use similar conditions for hotels and consumers to use their platform as these two do.
Our research has led to the following additional information:
- We use information from the Continuous Holiday Survey conducted under Dutch households to make estimates on the amounts they spend on travel. From 2015 onwards, this survey contains information on the amount paid for the accommodation and the type of accommodation travellers stayed in. For previous years, we only have the total amount spent on the holiday. For 2015 and 2016, we calculated the amount spent on hotel services per quarter set off against the total amount spent on the holiday. This proved very stable ratios between both years at 18 percent, 14 percent, 10 percent and 17 percent of the total. These ratios were then used on the totals spent on the holiday per quarter for the previous years. This results in a slowly increasing time series of total Dutch spending on accommodations abroad of a little less than 2 billion euros.
- To determine the part of the payment which is reserved for the hotel service and the part paid as a fee for the intermediation, we need to know which percentage of a booking is paid to the platform. There are some different terms and conditions possible, but in general 15 percent (Skift, 2020) of the total paid amount is for the intermediation by Expedia or Booking.com. As they are the dominant players in the market, we use this ratio for all platforms.
- To determine the market share of platforms in the total of hotel services imported by Dutch travellers we used data collected by HOTREC (2018). HOTREC is the umbrella association of Hotels, Restaurants, Cafés & similar establishments in Europe. They have data for 2013, 2015, 2017 and 2019 on the market share of platforms in the booking of hotel services in Europe. For the years for which we have data, we see a steady increase of the market share. We therefore assume that the missing years hold the middle between the values for 2013 and 2015 for 2014, and respectively the middle between the values for 2015 and 2017 for 2016. For the years before 2013, no reference was found. We did look into the development of the turnover for Booking.com, but this did not seem completely representative for the Netherlands, as Booking.com started here. We ended up using the 2013/2014 growth as a proxy for the year-on-year growth from 2010-2013.
- The HORTEC data also has a division to exact platforms in Europe for the booking of hotel services. The latter is necessary as Booking.com, the market leader with the share of 63.5 percent in 2015, is a Dutch-based company and therefore the intermediation service is not imported. We used the market share for Expedia (17.7 percent in 2015), HRS (12.8 percent in 2015) and their market share in the total on the non-specified platforms (7.3 percent, of which we assume 32 percent is imports).
Based on this additional information we created an estimate for the import of digital intermediation services of hotel services which consists of the revenue earned by foreign platforms by supply of intermediation of hotel services to the Dutch travellers. We estimate that this revenue at 17 million euros in 2010 has risen to 22 million euros in 2017.
| Units of measure | 2010 | 2011 | 2012 | 2013 | 2014 | 2015 | 2016 | |
|---|---|---|---|---|---|---|---|---|
| Market share of platforms in the booking of hotel services | % | 16 | 17 | 19 | 20 | 22 | 23 | 25 |
| Market share of non-Dutch online platforms for hotel services | % | 43 | 40 | 38 | 36 | 34 | 32 | 30 |
| Total hotel services imports of Dutch travellers | millions | 1,636 | 1,766 | 1,907 | 1,880 | 1,847 | 1,889 | 1,921 |
| Spending of Dutch travellers on hotel services via foreign online platforms | millions | 113 | 120 | 138 | 135 | 138 | 139 | 144 |
| Import of hotel intermediation services from non-Dutch online platforms by Dutch travellers (15%) | millions | 17 | 18 | 21 | 20 | 21 | 21 | 22 |
3.3 Upscaling taxi services due to digital intermediation
Import of taxi services due to digital intermediation is currently a part of travel measured in the international trade in service statistics. However, it is only a part in a larger category which proved impossible to split. To compile an estimate of the import taxi services due to digital intermediation we created a model without using ITSS. This model holds several assumptions.
We assume that:
- Uber only became relevant in Europe in 2013 (CBSinsights, 2020). For the preceding years, we assume that no taxi services via intermediated platforms were imported by Dutch tourists abroad.
- For the 2010-2016 period, Uber was by far the dominant market player. We assume their data is therefore applicable for all taxi services due to digital intermediation.
- People who used an Uber on their holiday in the earlier years (2012-2014) when this was not commonplace are “early adapters” who are likely to do the same on a next holiday. On average, people who say they have ordered a taxi via digital intermediation, will most likely have done so more than once in a year as people often need to get to and from a certain place such as the airport and people can have multiple holidays in one year. We make an expert guess that people who have ordered a taxi via digital intermediation in a year will have taken 2 Uber rides.
- For this estimate we use data from the Continuous Holiday Survey conducted among Dutch households. The part of this data we use here was collected by asking people who had travelled for business purposes in 2016 on their use of digital intermediation to order taxi services on personal holidays. We assume that the estimate for this subsample of the Dutch residents is applicable to all Dutch residents who go on holiday.
- People who go on business trips will also go on a personal holiday in that year.
- People generally go on holiday with their household.
- We leave business-related travel out of this research as we assume that Uber use during a business-related stay abroad will be paid by the enterprise and thereby it will be included in the business statistics and not as a personal expenditure.
Our research has led to the following additional information:
- We use information from the Continuous Holiday Survey conducted among Dutch households to make estimates on the amounts they spend on business-related travel. For 2016, extra questions were added on the use of platforms. One of the questions to respondents was whether they had ordered a taxi via digital intermediation on personal holidays abroad. The results of this survey in 2016 were that 7 percent of the grossed up sample indicated to have ever used digital intermediation to order a taxi on a personal holiday abroad (CBS, 2017b).
- To determine the annual growth of digital intermediation on taxi services we use the revenue of Uber. This has grown from 0.1 billion in 2013 to 6.5 billion in 2016 (Statista, 2020).
- As we know the share of people who have used digital intermediation to order a taxi, we need to know how many households there are in the Netherlands. This we know from our own data (CBS, 2020c).
- We also need the CBS information on the share of the population that goes on holiday, as we assume that business travellers go on personal holiday and that their use of digital intermediation on taxi services is representative for other Dutch travellers abroad on personal holidays. Roughly 80 percent of the Dutch population go on holiday each year (CLO, 2017).
- Finally we need to know how much a Dutch tourist pays a taxi driver which they booked through digital intermediation. We use information on what an Uber driver makes on average from a ride. We found this to be 15 euros.
Combining this information we come to the following model for the share of Dutch citizens who go on holiday and who use digital intermediation to book a taxi abroad. We use the distribution of the revenue of Uber in the 2013-2016 period to distribute the 7 percent who ever used digital intermediation to book a taxi according to CBS (2017b). Next we use the assumption for the period 2013-2014, that people who book taxis via digital intermediation are loyal customers and that they will use this service in each flowing year as well. This results in an estimate of 0.08 percent in 2013 of the Dutch population who goes on holiday and has booked a taxi through digital intermediation. This share of the Dutch population has grown to 5.7 percent in 2016.
| Units of measure | 2013 | 2014 | 2015 | 2016 | |
|---|---|---|---|---|---|
| Uber revenu | billions | 0.1 | 0.5 | 1.5 | 6.5 |
| Revenue share per year | % | 1 | 6 | 17 | 76 |
| Distribution of 7% who ever used a digitally ordered taxi | % | 0.08 | 0.41 | 1.22 | 5.29 |
| Assuming that 2013/2014 customers are loyal customers | % | 0.08 | 0.49 | 1.63 | 5.70 |
Furthermore, we need to calculate the amounts of imports of taxi services this results in. We take the share of Dutch tourists that ordered a taxi via digital intermediation from the table above. We multiply this share by the number of taxi rides we assumed a tourist would make via digital intermediation. We assume this will be at least 2 rides. This estimate we multiply by the share of Dutch population (as 7 percent indicates to have digitally ordered a taxi service abroad), multiply this by the number of households in the Netherlands, as we assume most people will go on holiday with their household, multiply this by the percentage of Dutch citizens who go on holiday and multiply this with the average turnover per ride for the taxi driver. From this model we deduct that the Netherlands imported 7 million euros of digitally ordered taxi services in 2016.
| Units of measure | 2010 | 2011 | 2012 | 2013 | 2014 | 2015 | 2016 | |
|---|---|---|---|---|---|---|---|---|
| Assuming that 2013/2014 customers are loyal customers | % | 0 | 0 | 0 | 0.1 | 0.5 | 1.6 | 5.7 |
| Rides per person per year abroad | number | 0 | 0 | 0 | 2 | 2 | 2 | 2 |
| Dutch households | millions | 7.4 | 7.4 | 7.5 | 7.6 | 7.6 | 7.7 | 7.7 |
| Percentage of Dutch citizens who go on holiday yearly | % | 82 | 82 | 81 | 81 | 80 | 80 | 81 |
| Average revenue of the taxi driver per ride | euros | 15 | 15 | 15 | 15 | 15 | 15 | 15 |
| Import of taxi services due to digital intermediation of Dutch citizens | millions | 0 | 0 | 0 | 0 | 1 | 2 | 7 |
3.4 Digital intermediation of travel (not taxi) services
Import of digital intermediation services of travel (not taxi) services is currently a part of travel measured in the international trade in services statistics. Digital intermediation of travel (not taxi) services focuses on the parts in travel which lend themselves for digital intermediation, which we have not yet studied in this grant. This consists of:
- Foreign digital intermediation on overnight stays in bungalow parks or campsites, boats or youth hostels (we will use “other accommodations” from here onwards).
- Foreign digital intermediation on car rental.
- Foreign digital intermediation on excursions and tickets.
In order to make estimates on this digital intermediation we use several sources:
- We use information from the Continuous Holiday Survey (CHS) conducted under Dutch households to make estimates on the amounts they spend on travel. From 2015 onwards, this survey contains information on the amount paid for the accommodation and the type of accommodation travellers stayed in, local transportation (including rental cars, petrol and public transportation) and how much they spend on excursions and tickets. For 2010-2014, we only have the total amount spent on the holiday. For 2015 and 2016, we calculated the amount spent on these services per quarter set off against the total amount spend on the holiday. These ratios proved rather stable. The ratios were then used on the totals spent on the holiday per quarter for the previous years. This results in a slowly increasing time series of total Dutch spending on overnight stays in other accommodations, local transportation and tickets and excursions.
| Units of measure | 2010 | 2011 | 2012 | 2013 | 2014 | 2015 | 2016 | |
|---|---|---|---|---|---|---|---|---|
| Other accommodations | millions | 1,495 | 1,604 | 1,720 | 1,670 | 1,666 | 1,718 | 1,701 |
| Local transport | millions | 542 | 585 | 631 | 619 | 612 | 626 | 634 |
| Tickets and excursions | millions | 538 | 578 | 622 | 613 | 603 | 614 | 628 |
For other accommodations and tickets and excursions, the definitions of the CHS line up with the ones we need. Local transportation on the other hand is too broad for only the car rental, which we need here. We therefore need to take a different approach to the car rental. In our search we found that in 2012 a research for Sunny Cars (2012) concluded that 35 percent of all air travellers rent a car. We decided to take this ratio as a reliable proxy to use this and build our model with the following assumptions:
- Only air travellers rent cars abroad
- For 2012, we use the 35 percent as mentioned in the research. This also stated that in 2011 this was 2 percent less. We use this growth to cast back the ratio for 2010 and 2012-2016 share of air travellers that rent a car.
- In 2018, the Trend report of Sunny Cars tells us that 58 percent of the costumers rent the car for the entire holiday, 35 percent for more than one day, on average half of the days and 7 percent rent a car for one day. In general this research indicates that people who rent a car rent it for close to three-quarters of the holiday. We use this for our estimates as Sunny Cars is the market leader in the Netherlands.
- There are a lot of different prices for rental cars, but we assume a rental car costs about 15 euros per day.
We combine these estimations with information of the Continuous Holiday Survey on the number of people who went on holiday by air and the number of days they stayed on holiday. This results in the following model where imports of car rental are about half of the total local transport costs we saw in table 3.4.1, which seems plausible.
| Units of measure | 2010 | 2011 | 2012 | 2013 | 2014 | 2015 | 2016 | |
|---|---|---|---|---|---|---|---|---|
| Air travel | millions | 6.3 | 6.6 | 6.8 | 6.6 | 6.9 | 7.0 | 6.8 |
| Percentage of Dutch air travelers who rent a car abroad | % | 34 | 35 | 36 | 36 | 37 | 38 | 39 |
| Average days people rent a car on holiday | days | 7 | 7 | 7 | 7 | 7 | 7 | 7 |
| Average cost per day to rent a car on holiday | euros | 15 | 15 | 15 | 15 | 15 | 15 | 15 |
| Total imports of rental car services by Dutch consumers | millions | 226 | 241 | 255 | 253 | 269 | 279 | 276 |
This results in estimations shown in an updated table 3.4.3 below in which we use the estimated costs of car rental services from table 3.4.2. We combine this with the key figures of 3.2, as most of these services are booked through hotel intermediation platforms. This results in an estimate for the imports of digital intermediation of travel (not taxi) of 29 million in 2016.
| Units of measure | 2010 | 2011 | 2012 | 2013 | 2014 | 2015 | 2016 | |
|---|---|---|---|---|---|---|---|---|
| Other accommodations | millions | 1,495 | 1,604 | 1,720 | 1,670 | 1,666 | 1,718 | 1,701 |
| Car rental | millions | 226 | 241 | 255 | 253 | 269 | 279 | 276 |
| Tickets and excursions | millions | 538 | 578 | 622 | 613 | 603 | 614 | 628 |
| Market share of platforms in the booking of hotel services | % | 16 | 17 | 19 | 20 | 22 | 23 | 25 |
| Market share of non-Dutch online platforms for hotel services | % | 43 | 40 | 38 | 36 | 34 | 32 | 30 |
| Spending of Dutch travellers on digital intermediation (not taxi) via foreign online platforms | millions | 155 | 165 | 188 | 183 | 190 | 192 | 195 |
| Imports of digital intermediation of travel (not taxi) from non-Dutch online platforms by Dutch travellers (15%) | millions | 23 | 25 | 28 | 27 | 28 | 29 | 29 |
3.5 Database services and database originals imports
The import of database services and database originals by enterprises is currently a part of the international trade in services statistics. Imports of database services and database originals by consumers is not yet captured in regular statistics.
Results
The estimation of imports of database services and database originals is presented in table 3.5.2. The value of the imported database services almost doubles in the 2010-2016 period, from 1.59 billion in 2010 to close to 3 billion in 2016. We have to make some remarks with respect to presented in table 3.5.2 figures. We deliberately did not use the category “Computer services, excluding ownership rights” for estimation database services, as it exceeds the definitions of them. Unfortunately we cannot estimate the probable share of database services in the category “Computer services, excluding ownership rights” by manually extraction or by any individual research due to complicated subject matter and a number of enterprises reporting “Computer services, excluding ownership rights”. On the other hand, we are aware that many companies will report cloud services under software licences as nowadays cloud services are often provided via “Software-as-a service” agreement. Taken all this into account we present below the estimated value of database-related services and database originals set off against the total value of the so called ICT-enabled services: “Computer services, excluding ownership rights”, “Computer software licences to use”, “Computer software licences to reproduce and distribute” and “Other information services” in our ITSS survey.
Enterprises
Following EBOPS 2010 - CPC 2.0 detailed correspondence table [1], licences to reproduce and/or distribute computer software comprise: Licensing services for the right to use computer software and databases as well licensing services for the right to reproduce, distribute or incorporate databases (i.e. compilations of facts/information) in other databases or applications. This applies to various levels of licensing rights:
- rights to reproduce and distribute the database
- rights to use database components for the creation of and inclusion in other databases and applications.
In the Dutch ITSS business survey we ask respondents to report the following categories which corresponds with the EBOPS definitions:
- Licences to reproduce and/or distribute computer software (SH3)
- Licences to use computer software (SI21Y)
- Other information services (which includes database services and database originals) (SI32).
Making the assumption that the database services and related transfer of ownership rights through licensing are intrinsically included into above-mentioned questions, we will calculate the B2B part of import of database services (including database originals) based on above mentioned questions (1), (2) and (3) from our ITSS survey. We first selected all 744 enterprises that reported to have imported either (1), (2) or (3) in the years 2014-2016. Per type of service (SH3,SI21Y,SI32), we determined which enterprises contributed the most to the total of the service and we manually checked the largest enterprises to determine if their type of services could be classified as the import of database services or database originals. We checked a minimum of 67 percent of the value per service. The results of the checked enterprises can be seen in table 3.5.1 below. We used these ratios on the total value of the service per year to determine the value of the import of database services and database originals.
| Units of measure | 2014 | 2015 | 2016 | |
|---|---|---|---|---|
| SH3 | % | 40 | 39 | 31 |
| SI21Y | % | 39 | 50 | 47 |
| SI32 | % | 100 | 100 | 100 |
For special purpose entities and monetary financial institutions we looked into the enterprises as well. We made some larger adjustments on the value of the database services and database originals in these types of enterprises as our national accounts determined in their previous revision that one large enterprise should not be considered a service trader.
To make an estimate of the 2010-2013 database services and database originals we used 2010-2013 estimates of the BPM6 services which we made at the time of the BPM5-BPM6 transition, in 2013. In the last years, we improved the 2013 estimate to be better in line with the 2014 realisation of the BPM6 services. We used these improved 2013 figures and we used the growth in the older BPM6 2010-2013 estimate to cast back to earlier years.
All the above-mentioned steps result in the figures presented in table 3.5.2 below. The value of the imported database services almost doubles in the 2010-2016 period, from 1.59 billion in 2010 to close to 3 billion in 2016. We deliberately did not use the category “Computer services, excluding ownership rights”, as it exceeds the definitions of database services. Unfortunately we cannot estimate the probable share of database services in the category “Computer services, excluding ownership rights” by manually extraction or by any individual research due to complicated subject matter and a number of enterprises reporting “Computer services, excluding ownership rights”. On the other hand, we are aware that many companies will report cloud services under software licences as nowadays cloud services are often provided via “Software-as-a service” agreement. Taken all this into account we present below the estimated value of database-related services and database originals set off against the total value of the so-called ICT enabled services: “Computer services, excluding ownership rights”, “Computer software licences to use”, “Computer software licences to reproduce and distribute” and “Other information services” in our ITSS survey.
| Units of measure | 2010 | 2011 | 2012 | 2013 | 2014 | 2015 | 2016 | |
|---|---|---|---|---|---|---|---|---|
| Database services and database originals imported by enterprises | millions | 1,588 | 1,440 | 1,777 | 2,803 | 2,926 | 2,818 | 2,929 |
| ICT enabled services imported by enterprises (SH3, SI2X, SI21Y & SI32) | millions | 8,000 | 7,279 | 8,592 | 9,681 | 10,106 | 10,681 | 11,652 |
Consumers
We tried to make an estimate of Dutch import of database services and database originals by consumers by using data from several external sources on Dutch consumers. This unfortunately did not result in plausible outcomes. To come to an acceptable estimate we modelled German estimations (Meinusch & Hessel, 2019) made by the Deutsche Bank in 2019 on digital trade of German households. In this research Deutsche Bank measures digital economy where their estimates specified by several different services including cloud services. We believe these are the types of services we are looking for to estimate Dutch consumers imports of database services and database originals bought outside the Netherlands. We make the German estimates suitable for Dutch consumers by correcting their estimate for the difference in population (Eurostat, 2020).
| Units of measure | 2010 | 2011 | 2012 | 2013 | 2014 | 2015 | 2016 | |
|---|---|---|---|---|---|---|---|---|
| German estimates for cloud services | millions | 37 | 51 | 64 | 87 | 123 | 155 | 184 |
| Population Germany | millions | 81.8 | 80.2 | 80.3 | 80.5 | 80.8 | 81.2 | 82.8 |
| Population Netherlands | millions | 16.6 | 16.7 | 16.7 | 16.8 | 16.8 | 16.9 | 17.0 |
| Dutch estimates for cloud services | millions | 8 | 11 | 13 | 18 | 26 | 32 | 38 |
Combined
In total we estimate that the imports of database services and database originals of Dutch enterprises and consumers adds up to approximately 3 billion euros in 2016.
| Units of measure | 2010 | 2011 | 2012 | 2013 | 2014 | 2015 | 2016 | |
|---|---|---|---|---|---|---|---|---|
| Database services and database originals imported by enterprises | millions | 1,588 | 1,44 | 1,777 | 2,803 | 2,926 | 2,818 | 2,929 |
| Database services and database originals imported by consumers | millions | 8 | 11 | 13 | 18 | 26 | 32 | 38 |
| Estimate of Dutch import of database services and database originals | millions | 1,596 | 1,451 | 1,79 | 2,821 | 2,952 | 2,85 | 2,967 |
3.6 Imports of goods via e-commerce as a sales channel
The import of goods via e-commerce is part of the international trade in goods statistics if it is imported from outside the EU and has a value of 22 euros or more. Smaller amounts and imports of goods from other EU-countries are not registered in a statistic, but an estimate is made for the national accounts. We try to make a new estimate here. To compile an estimate of the import of goods via e-commerce we created a two-part model. First, we estimate the import of goods via e-commerce by consumers and second we estimate the same for enterprises.
Consumers
Our research has led to the following additional information:
- Research done by Thuiswinkel.org (2017) gives us for the years 2010-2016 the amount that Dutch consumers spent on shopping online. For 2013-2016, this research also provides us with information on their spending on foreign websites. For 2016 and 2017, information is available on the share of online shopping that is spent on goods versus services.
From this research we made the following model in which 2017 was necessary for the back cast of the share of goods in the total spending on foreign websites. The estimated shares, made by back casting, are in grey and italic. We estimate that 3.19 percent of total goods and services bought online in 2015 were bought from a foreign website. Of this share of 3.19 percent, we knew that 61 percent were goods. This resulted in an estimate of 313 million euros spent on goods imported via e-commerce (CBS, 2020d).
| Units of measure | 2010 | 2011 | 2012 | 2013 | 2014 | 2015 | 2016 | 2017 | |
|---|---|---|---|---|---|---|---|---|---|
| Total spending of Dutch consumers via e-commerce | millions | 8,210 | 8,980 | 9,800 | 10,600 | 13,960 | 16,070 | 20,160 | 22,500 |
| Spending of Dutch consumers in foreign via e-commerce | millions | 150 | 390 | 513 | 637 | 765 | |||
| Part goods in the spending of Dutch consumers via foreign e-commerce | millions | x | 384 | 455 | |||||
| Percentage of spending via e-commerce in foreign web shops in total spending | % | 0.18 | 0.36 | 0.72 | 1.42 | 2.79 | 3.19 | 3.16 | 3.40 |
| Percentage of goods in Dutch consumers spending via foreign e-commerce | % | 65 | 64 | 64 | 63 | 62 | 61 | 60 | 59 |
| Estimate of spending of Dutch consumers on goods via foreign e-commerce | millions | 10 | 21 | 45 | 94 | 242 | 313 | 384 | 455 |
Enterprises
Our research has led to the following additional information:
- Statistics Netherland asked enterprises with 10 or more employees about their IT use (CBS, 2020e), this includes e-commerce. From 2013 onwards, questions are included on which part of their purchases are done via e-commerce (around 7 percent) and what part of those purchases are done abroad (around 10 percent). For earlier years, the questions are slightly different and do not include if the purchases are done abroad.
- To split the purchases in goods and services we need to use the division between goods and services in the imports. For most years, this is little over 70 percent of the total imports (CBS, 2020f).
To compile an estimate of the goods imported by enterprises through e-commerce we created a model with several assumptions. We assume that:
- Enterprises with fewer than 10 employees use e-commerce in similar ways in their imports as enterprises with 10 or more employees.
- The IT use questionnaire only asks enterprises if they purchase from e-commerce channels and if that purchase is within 8 ranges. To come to an average purchase from e-commerce channels we assumed that for all the enterprises who indicate a certain range we can use the mean of that range. For the last range, more than 50 percent of the purchases are done via e-commerce. We assume 60 percent for all those enterprises. This results in the non-coloured percentages of e-commerce in the total purchases.
| Ranges | Used percentage | 2010 | 2011 | 2011b1) | 2012 | 2013 | 2014 | 2015 | 2016 |
|---|---|---|---|---|---|---|---|---|---|
| 0% | 0% | 67 | 86 | 57 | 47 | 44 | 53 | 47 | 42 |
| 0-1% | 0.5% | 5 | 2 | 15 | 24 | 26 | 22 | 22 | 27 |
| 1-2% | 1.5% | 4 | 1 | 4 | 4 | 4 | 3 | 5 | 5 |
| 2-5% | 3.5% | 2 | 1 | 3 | 5 | 5 | 4 | 5 | 6 |
| 5-10% | 7.5% | 5 | 2 | 4 | 3 | 4 | 3 | 4 | 4 |
| 10-25% | 17.5% | 6 | 2 | 5 | 4 | 6 | 4 | 5 | 6 |
| 25-50% | 37.5% | 4 | 2 | 4 | 4 | 3 | 3 | 4 | 4 |
| >50% | 60% | 7 | 4 | 8 | 9 | 8 | 8 | 8 | 6 |
| Share of e-commerce in total purchases | 7.3 | 3.7 | 7.7 | 8.2 | 7.6 | 7.1 | 7.8 | 6.9 | |
- In the table above, 2011 is very different from the other years. We therefore assume this is not the best estimate for 2011 and we replace this estimate with the 2011b one, which holds the middle between 2010 and 2012.
- For 2013-2016, we have information on the part of e-commerce purchases that are done abroad. For 2010-2012, we assume that we can safely use the 2013 percentage as the 2013-2016 percentages are rather consistent.
- We need information on the total purchases of enterprises in the Netherlands. This information is not available, partly due to security reasons. We do have the total turnover of the business economy (NACE B-N, excl. K, incl. 95) for 2011-2016 period (CBS, 2020g), turnover for 90 percent of the business economy for 2010-2016 and the corresponding purchases (CBS, 2020h). We assume that the part of the purchases in the turnover for 90 percent of the business economy per year is a good proxy for the part of the purchases in the total business economy.
| Units of measure | 2010 | 2011 | 2012 | 2013 | 2014 | 2015 | 2016 | |
|---|---|---|---|---|---|---|---|---|
| Turnover business economy | millions | 1,400,253 | 1,422,089 | 1,393,863 | 1,389,826 | 1,413,365 | 1,443,704 | |
| Turnover several NACE categories | millions | 1,179,125 | 1,293,383 | 1,308,717 | 1,280,668 | 1,277,375 | 1,297,353 | 1,321,691 |
| Purchases several NACE categories | millions | 756,771 | 853,581 | 867,293 | 842,041 | 832,292 | 829,944 | 835,399 |
| Estimated turnover (2011) business economy | millions | 1,276,554 | 1,400,253 | 1,422,089 | 1,393,863 | 1,389,826 | 1,413,365 | 1,443,704 |
| Estimated purchases business economy | millions | 819,302 | 924,111 | 942,425 | 916,467 | 905,561 | 904,159 | 912,52 |
- We also assume that the business economy is a good proxy for the total e-commerce purchases abroad.
Combining this information we come to the following model. For 2016, close to 7 percent of the purchases was done via e-commerce of which almost 10 percent was done abroad and of those, 72.3 percent were goods. This totals to 0.4 percent of all purchases is a good bought through e-commerce abroad. Of the estimated 9 billion purchases in our business economy this results in 4.3 billion euros as our estimate of the goods purchased by enterprises via foreign e-commerce. This is an increase from 2010, but not a steep one.
| Units of measure | 2010 | 2011 | 2012 | 2013 | 2014 | 2015 | 2016 | |
|---|---|---|---|---|---|---|---|---|
| Share of e-commerce in purchases | % | 7.3 | 7.7 | 8.2 | 7.6 | 7.1 | 7.8 | 6.9 |
| Share of e-commerce in purchases abroad | % | 7.7 | 7.7 | 7.7 | 7.7 | 10.5 | 9.5 | 9.6 |
| Share of goods in total purchases abroad | % | 74.2 | 75.1 | 75.7 | 74.5 | 74.0 | 68.1 | 72.3 |
| Estimated purchases business economy | millions | 819,302 | 924,111 | 942,425 | 916,467 | 905,561 | 904,159 | 912,52 |
| Estimate of good purchases of enterprises abroad via e-commerce | millions | 3,421 | 4,142 | 4,513 | 4,036 | 5,03 | 4,603 | 4,363 |
Combined
In total we estimate that the purchases of Dutch enterprises and consumers of goods via e-commerce abroad adds up to close to 5 billion euros in 2016.
| Units of measure | 2010 | 2011 | 2012 | 2013 | 2014 | 2015 | 2016 | |
|---|---|---|---|---|---|---|---|---|
| Estimate of goods purchased by Dutch enterprises abroad via e-commerce | millions | 3,421 | 4,142 | 4,513 | 4,036 | 5,03 | 4,603 | 4,363 |
| Estimate of goods purchased by Dutch consumers abroad via e-commerce | millions | 10 | 21 | 45 | 94 | 242 | 313 | 384 |
| Estimate of goods purchased abroad via e-commerce by Dutch enterprises and consumers | millions | 3,431 | 4,163 | 4,558 | 4,13 | 5,272 | 4,916 | 4,747 |
[1] Correspondence between the EBOPS 2010 and the Central Product Classification (CPC, version 2) - Detailed version Consulted from: https://unstats.un.org/unsd/tradeserv/tfsits/msits2010/ebops2cpc_detailed.htm
4. Conclusions, discussion and recommendations
This problem is compounded when trying to identify cross border transactions of digital products and services. Because in a digital economy ‘borders’ are often much less relevant and clear. While economically speaking this has had an enormous stimulating effect on cross border transactions it has also made identifying many of these transactions more and more difficult (information paradox). A change of ownership of a good or purchase of a service increasingly happens by a simple touch of a mouse button. But whether the transaction is digital is not always accurately reported.
Despite these difficulties it is possible to provide reasonable estimates for the activities explored in this research. Often this was done by combining available statistical data sources, augmented with external sources and further refining them by applying relevant assumptions.
In most cases the estimates can be based on already existing statistical data sources, providing a solid foundation to work with. In other cases, such a source simply is not available and we must therefore rely on external sources and sometimes more experimental innovative techniques to generate an estimation.
| Year | Goods via e-commerce as a sales channel (billion euros) | Database services and database originals (billion euros) | Dwelling services due to digital intermediation (billion euros) | Digital intermediation of other travel service (billion euros) | Digital intermediation of hotel services (billion euros) | Taxi services due to digital intermediation (billion euros) |
|---|---|---|---|---|---|---|
| 2010 | 3431 | 1596 | 0 | 23 | 17 | 0 |
| 2011 | 4163 | 1451 | 2 | 25 | 18 | 0 |
| 2012 | 4558 | 1790 | 16 | 28 | 21 | 0 |
| 2013 | 4130 | 2821 | 46 | 27 | 20 | 0 |
| 2014 | 5272 | 2952 | 76 | 28 | 21 | 1 |
| 2015 | 4916 | 2850 | 169 | 29 | 21 | 2 |
| 2016 | 4747 | 2967 | 341 | 29 | 22 | 7 |
The import of all activities is shown in graph 4.1. Contrary to exports, imports of digitised products do show a year-on-year growth, but not as exponential. The import of dwelling services due to digital intermediation and the import of taxi services due to digital intermediation do show that growth, but those activities are relatively small. The large digitised products are obviously the import of database services and database originals and the import of goods via e-commerce as a sales channel. The import of database services and database originals does double in the 2010-2016 period, but the import of goods via e-commerce as a sales channel “only” grows by 38 percent. Because of the difficulty in finding the correct data to fit the scope of this research, the outcome should be regarded with caution. Changing the interpretation of the scope, can have large effects on the outcome. One of the avenues which should definitely be looked into in follow-up studies is the use of the sales of EU-based web shops as developed by Statistics Netherlands (CBS, 2020d) for the purchases of goods via e-commerce by Dutch consumers.
This study does not quantify the extra purchases or imports triggered by digitalisation. It only attempts to make transactions related to digitalisation more visible in existing statistics and to explore where data is available in existing statistics. This study is an explorative attempt to quantify a few of these relevant digitised activities. The intent behind the study is not to give a complete overview of all imports of all digitised products.
In conclusion, this study provides a first reasonable experimental overview of the size of a few digitised activities in the Dutch economy. The status of this study is experimental. Feedback on the study is therefore very welcome.
Further research will be needed to improve these estimates. This research could focus on possible improvements in survey design for better specification of digital activities. Alternatively, innovative methods such as use of web scraping and machine learning are very promising and could be further explored in the future.
Literature
Ahmad, N. & Schreyer, P. (2016). Measuring GDP in a Digitalised Economy. OECD Statistics Working Papers 2016/07.
Airbnb (2020). What are Airbnb service fees?
CBS (2015). ICT, kennis en economie. Den Haag/Heerlen/Bonaire: Centraal Bureau voor de Statistiek.
CBS (2017a). Opbouw binnenlands product (bbp); nr, 1969-2016. [Dataset].
CBS (2017b). Trendrapport toerisme, recreatie en vrije tijd 2017. Den Haag/Heerlen/Bonaire: Centraal Bureau voor de Statistiek.
CBS (2019). Nederlanders kopen steeds vaker bij buitenlandse webwinkels. Den Haag/Heerlen/Bonaire: Centraal Bureau voor de Statistiek.
CBS (2020a). Opbouw binnenlandse product (bbp); nationale rekeningen. [Dataset].
CBS (2020b). Service export 12 percent down in Q2. Den Haag/Heerlen/Bonaire: Centraal Bureau voor de Statistiek.
CBS (2020c). Bevolking, huishoudens en bevolkingsontwikkeling; vanaf 1899. [Dataset].
CBS (2020d). Record spending in foreign EU webshops. Den Haag/Heerlen/Bonaire: Centraal Bureau voor de Statistiek.
CBS (2020e). Statline – Bedrijven – ICT en e-commerce. [Dataset].
CBS (2020f). Bbp, productie en bestedingen; kwartalen, waarden, nationale rekeningen. [Dataset].
CBS (2020g). Bedrijven; arbeid, financiële gegevens, bedrijfsgrootte, bedrijfstak. [Dataset].
CBS (2020h). Bedrijfsleven; arbeids- en financiële gegevens, per branche, SBI. [Dataset].
CBSinsights (2020). How Uber makes – and loses – money.
CLO (2017). Vakanties van Nederlanders, 1990-2016.
Colliers (2017). Airbnb in Amsterdam.
DBS (2019). Ride-sharing. Profitable or not?
Eurostat (2020). Population on 1 January.
Hartmans, A. (2017). Airbnb now has more listings worldwide than the top five hotel brands combined.
HOTREC (2018). European Hotel Distribution Study.
Kookie (2017). Airbnb: Growth and market share.
Lemmers, O. (2015). Bijdrage export aan bbp en werkgelegenheid neemt fors toe. Den Haag/Heerlen/Bonaire: Centraal Bureau voor de Statistiek.
Leonardo (2019). The Explosive Growth of Airbnb – An Infographic for Hoteliers.
Meinusch, A. & Hessel, B. (2019). Measuring Digital Trade A supplementary estimate of consumption of digital trade. Luxembourg: The Working Group on International Trade in Services Statistics.
Molla, R. (2019). American consumers spent more on Airbnb than on Hilton last year.
Nakamura, L. I., Samuels, J. & Soloveichik, R. H. (2016). Valuing 'Free' Media in GDP: An Experimental Approach. FRB of Philadelphia Working Paper No. 16-24.
Nguyen, D. & Paczos, M. (2020). Measuring the Economic Value of Data and Cross-Border Data Flows: A business perspective. OECD Digital Economy Paper, August 2020 No. 297.
NVL (2018). Populariteit leasing blijft stijgen.
OECD, IMF, Eurostat (2008). System of National Accounts 2008.
OECD (2011). Guide to Measuring the Information Society, 2011.
OECD (2014). Measuring the digital economy: new perspective.
OECD (2018). Taxi, ride-sourcing and ride-sharing services. Background Note by the Secretariat. OECD Working Party No. 2 on Competition and Regulation.
OECD (2019a). Handbook on Measuring Digital Trade.
OECD (2019b). “Trade in the Digital Era”. OECD Going Digital Policy Note. Paris: OECD.
Riemer, K., Gal, U., Hamann, J., Gilchriest, B. & Teixeira, M. (2015). Digital Disruptive Intermediaries: Finding new digital opportunities by disrupting established business models.
Skift (2020). Expedia Acknowledges a New Balance of Power With Hotels in Direct Booking Challenge.
Statista (2020). Global net revenue of Uber from 2013 to 2019.
Sunny Cars (2020). Nieuws van Sunny Cars.
Thelle, M. H., Rytter Sunesen, E., Basalisco, B., la Cour Sonne, M. & Fredslund, N. C. (2015). Online intermediaries : Impact on the EU economy. EDiMA.
Thuiswinkel.org (2017). Online uitgaven bij Chinese webshops stijgen met 59%.
Visconti, R. M. (2019). Corporate Governance, Digital Platforms and Network Theory: Information and Risk-Return Sharing of Connected Stakeholders.
Vos, S. & Loog, B. (2018). Uitbesteden van werk aan het buitenland door bedrijven in Nederland. In: M. Jaarsma & R. Voncken (Red.), Internationaliseringsmonitor 2018, tweede kwartaal: Werkgelegenheid. Den Haag/Heerlen/Bonaire: Centraal Bureau voor de Statistiek.