2. Data exploration
Both the EO and in-situ datasets were acquired through OSPAR, whereby the in-situ data can also downloaded through the ICES data portal. The chl-a indicator is used to address eutrophication, and thus only reflects concentrations in the upper 10 meters of the water column. While this depth limitation is inherent to the EO data, any in-situ measurements taken at greater depths are excluded from the analysis. Additionally, the indicator relies on growing season means, with the growing season, as defined by OSPAR, extending from March to September. The focus of this analysis is on these seven months, although algal blooms may occur outside this window, especially as climate change influences water temperatures in the North Sea1) 2). The analysis covers the period from 1998 to 2020, as both in-situ and EO data are available for these years.
2.1 In-situ data
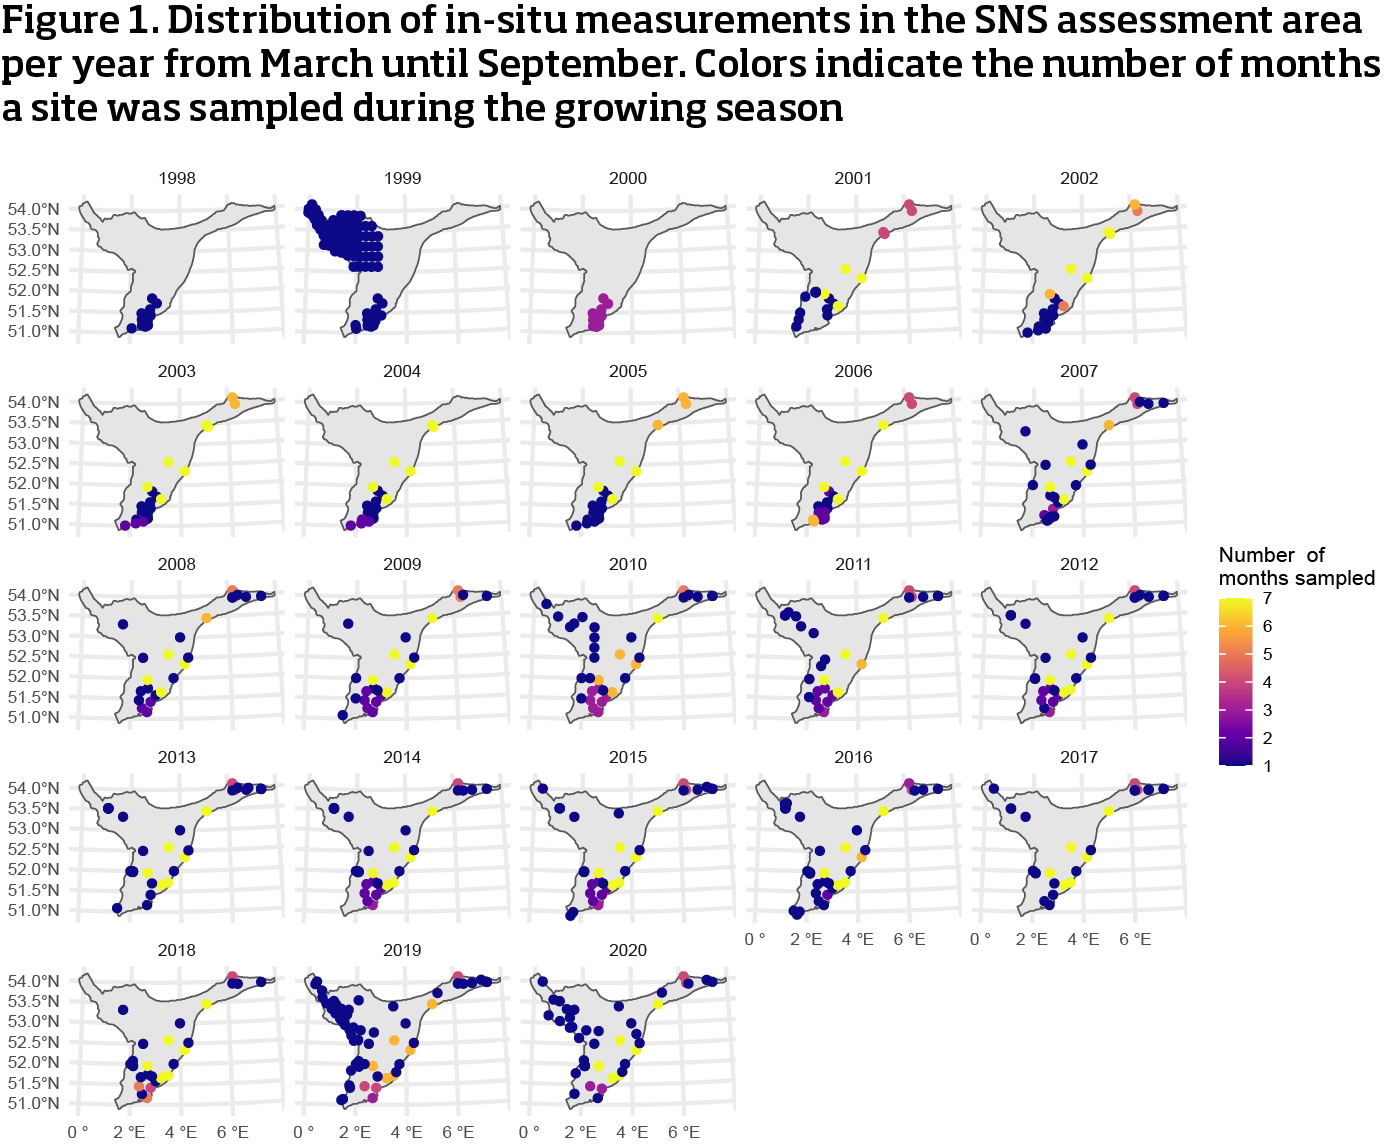
The number of in-situ measurements and chl-a concentrations in the Southern North Sea (SNS) assessment area are summarized in Table 1. The sample size fluctuated over the study period, with a peak in 2019, featuring approximately 131 samples during the growing season. The spatial distribution of these measurements is shown in Figure 1, which reveals that sampling sites are unevenly distributed, with a higher concentration of samples taken near the British, Belgian, and Dutch coasts. Only a few sites on the Dutch Continental Shelf were sampled throughout all months of the growing season, whereas most sites were sampled only during a single month (although not all in the same month, see distribution over months sampled per year in Table 1).
2019 was the most sampled year, and the development of quantile chl-a concentrations during that year’s growing season is depicted in Figure 2. Although no data is available for March, the results show elevated chl-a concentrations during the spring bloom, particularly near the Dutch coast. However, the sparse spatial distribution of samples makes it difficult to discern broader patterns across the entire SNS area.
| year | chl-a (mean) | chl-a (sd) | n | n months | n days |
|---|---|---|---|---|---|
| 1998 | 4,76 | 4,18 | 43 | 7 | 23 |
| 1999 | 18,90 | 15,83 | 128 | 4 | 15 |
| 2000 | 10,85 | 10,26 | 39 | 3 | 7 |
| 2001 | 6,54 | 6,70 | 78 | 7 | 37 |
| 2002 | 5,04 | 3,85 | 99 | 7 | 41 |
| 2003 | 6,80 | 8,59 | 108 | 7 | 43 |
| 2004 | 5,98 | 5,68 | 107 | 7 | 35 |
| 2005 | 4,80 | 5,08 | 103 | 7 | 40 |
| 2006 | 4,23 | 4,00 | 102 | 7 | 47 |
| 2007 | 4,91 | 5,82 | 80 | 7 | 39 |
| 2008 | 4,60 | 6,62 | 65 | 7 | 36 |
| 2009 | 3,38 | 4,63 | 94 | 7 | 46 |
| 2010 | 2,93 | 3,23 | 92 | 7 | 35 |
| 2011 | 4,17 | 4,93 | 103 | 7 | 46 |
| 2012 | 2,55 | 2,38 | 117 | 7 | 50 |
| 2013 | 2,51 | 3,17 | 106 | 7 | 46 |
| 2014 | 3,39 | 3,33 | 110 | 7 | 43 |
| 2015 | 4,25 | 4,11 | 107 | 7 | 47 |
| 2016 | 4,97 | 7,63 | 100 | 7 | 44 |
| 2017 | 4,15 | 6,37 | 90 | 7 | 43 |
| 2018 | 3,87 | 4,30 | 101 | 7 | 50 |
| 2019 | 2,75 | 4,66 | 131 | 6 | 56 |
| 2020 | 2,48 | 2,03 | 117 | 7 | 51 |
| 1) N is based on unique samples per site and timestamp, replicates are not considered. | |||||

2.2 Earth Observation data
EO data is extremely well sampled throughout the SNS assessment area (Table 2), with millions of measurements that span the entire duration of the growing season. All months, and almost all days, are sampled during each year in contrast to the in-situ data (Table 1). For more background on the acquisition of EO data, see Van der Zande et al. (2019)3) and Lavigne et al. (2021)4).
| year | chl-a (mean) | chl-a (sd) | n | n months | n days |
|---|---|---|---|---|---|
| 1998 | 3,19 | 3,08 | 2072362 | 7 | 188 |
| 1999 | 3,73 | 4,37 | 3294312 | 7 | 202 |
| 2000 | 2,43 | 2,14 | 2733508 | 7 | 190 |
| 2001 | 4,21 | 4,87 | 3330415 | 7 | 181 |
| 2002 | 2,79 | 1,89 | 4121014 | 7 | 196 |
| 2003 | 3,54 | 3,27 | 6032644 | 7 | 204 |
| 2004 | 2,98 | 2,40 | 5013950 | 7 | 203 |
| 2005 | 2,92 | 2,48 | 4641851 | 7 | 197 |
| 2006 | 2,77 | 2,28 | 5533996 | 7 | 195 |
| 2007 | 3,48 | 3,45 | 5126752 | 7 | 204 |
| 2008 | 3,71 | 3,51 | 4928548 | 7 | 206 |
| 2009 | 2,85 | 3,06 | 5506865 | 7 | 209 |
| 2010 | 3,43 | 3,41 | 5109299 | 7 | 200 |
| 2011 | 3,13 | 3,11 | 5019536 | 7 | 197 |
| 2012 | 2,60 | 2,56 | 5259718 | 7 | 201 |
| 2013 | 3,59 | 3,69 | 5757591 | 7 | 195 |
| 2014 | 3,04 | 3,43 | 5187452 | 7 | 203 |
| 2015 | 3,03 | 3,37 | 5619866 | 7 | 205 |
| 2016 | 2,90 | 2,94 | 6327410 | 7 | 207 |
| 2017 | 2,63 | 2,54 | 5882981 | 7 | 208 |
| 2018 | 2,72 | 2,59 | 6198899 | 7 | 205 |
| 2019 | 2,73 | 2,88 | 5942578 | 7 | 208 |
| 2020 | 3,00 | 2,52 | 6692037 | 7 | 210 |
Table 2 highlights the temporal coverage of the Earth Observation (EO) data, while Figure 3 presents the spatial distribution of this data for the year 2019. To appropriately visualize the data, chl-a concentrations were aggregated to a 5x5 km grid (the original resolution of the EO data being 1x1 km). These aggregated values were then categorized into quantiles. The results demonstrate that the EO data effectively captures both spatial and temporal patterns of chl-a concentrations throughout the growing season. Notably, higher concentrations are observed during early phytoplankton blooms from March to May, with levels being generally elevated near the coast.
In the later years of the monitoring period, the EO data provides excellent coverage of the SNS area. However, coverage was less comprehensive in the earlier years (see differences in n Table 2; and Figure 4), with some months showing gaps in 5x5 km grid data. Despite these early gaps, the EO data coverage of the SNS area remains nearly complete.


2.3 Conclusion data exploration
Large differences exist between the spatial and temporal distribution of the in-situ and EO datasets, with the two datasets not being directly comparable, as illustrated in Table 3. The number of in-situ samples is substantially smaller than that of the EO data, both in terms of temporal coverage and spatial distribution. In-situ data is not representative of the entire SNS assessment area, and in many years, there are gaps where not all months of the growing season were sampled.
Given these discrepancies, a strong recommendation is to treat in-situ samples as individual data points alongside the EO data. Aggregating both datasets before calculating growing season averages may provide a more accurate representation of the overall conditions. If and how the current weighting method may introduce biases is explored in the next chapter.
| year | n EO | n in-situ | n total | % in-situ | % EO |
|---|---|---|---|---|---|
| 1998 | 2072362 | 43 | 2072405 | 0,0021 | 99,9979 |
| 1999 | 3294312 | 128 | 3294440 | 0,0039 | 99,9961 |
| 2000 | 2733508 | 39 | 2733547 | 0,0014 | 99,9986 |
| 2001 | 3330415 | 78 | 3330493 | 0,0023 | 99,9977 |
| 2002 | 4121014 | 99 | 4121113 | 0,0024 | 99,9976 |
| 2003 | 6032644 | 108 | 6032752 | 0,0018 | 99,9982 |
| 2004 | 5013950 | 107 | 5014057 | 0,0021 | 99,9979 |
| 2005 | 4641851 | 103 | 4641954 | 0,0022 | 99,9978 |
| 2006 | 5533996 | 102 | 5534098 | 0,0018 | 99,9982 |
| 2007 | 5126752 | 80 | 5126832 | 0,0016 | 99,9984 |
| 2008 | 4928548 | 65 | 4928613 | 0,0013 | 99,9987 |
| 2009 | 5506865 | 94 | 5506959 | 0,0017 | 99,9983 |
| 2010 | 5109299 | 92 | 5109391 | 0,0018 | 99,9982 |
| 2011 | 5019536 | 103 | 5019639 | 0,0021 | 99,9979 |
| 2012 | 5259718 | 117 | 5259835 | 0,0022 | 99,9978 |
| 2013 | 5757591 | 106 | 5757697 | 0,0018 | 99,9982 |
| 2014 | 5187452 | 110 | 5187562 | 0,0021 | 99,9979 |
| 2015 | 5619866 | 107 | 5619973 | 0,0019 | 99,9981 |
| 2016 | 6327410 | 100 | 6327510 | 0,0016 | 99,9984 |
| 2017 | 5882981 | 90 | 5883071 | 0,0015 | 99,9985 |
| 2018 | 6198899 | 101 | 6199000 | 0,0016 | 99,9984 |
| 2019 | 5942578 | 131 | 5942709 | 0,0022 | 99,9978 |
| 2020 | 6692037 | 117 | 6692154 | 0,0017 | 99,9983 |
2) Tinker, J., Lowe, J., Pardaens, A., Holt, J., & Barciela, R. (2016). Uncertainty in climate projections for the 21st century northwest European shelf seas. Progress in Oceanography, 148, 56–73.
3) Van der Zande, D., Lavigne H., Blauw A., Prins T., Desmit X., Eleveld M., Gohin F., Pardo S., Tilstone G., Cardoso Dos Santos J., Coherence in Assessment Framework of Chlorophyll A and Nutrients as Part of the EU Project ‘Joint Monitoring Programme of the Eutrophication of the North Sea With Satellite Data’ (Ref: DG ENV/MSFD Second Cycle/2016) (2019). Activity 2 Report (106 pp)
4) Lavigne H., Van der Zande D., Ruddick K., Cardoso Dos Santos J., Gohin F., Brotas V., Kratzer S., Quality-control tests for OC4, OC5 and NIR-red satellite chlorophyll-a algorithms applied to coastal waters (2021). Remote Sensing of Environment 255: 112237.