The COVID-19 pandemic: how did it affect statistics?

How did coronavirus affect statistics?
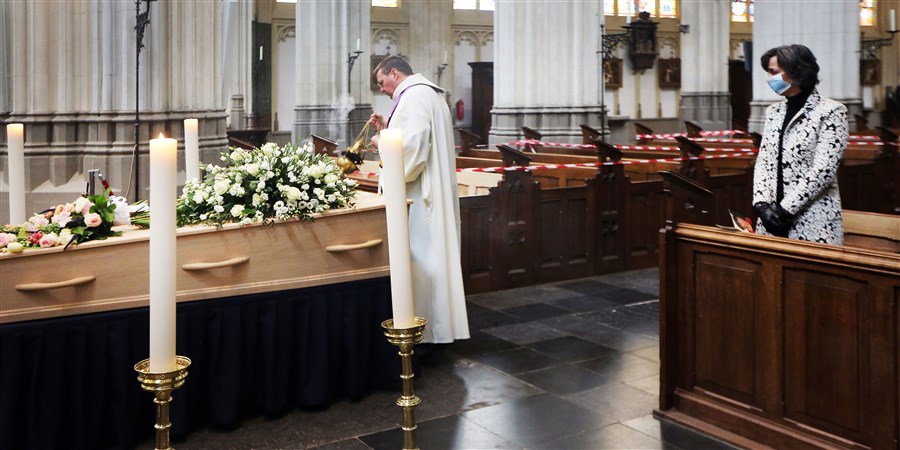
On 3 April 2020, CBS published its first news release reporting that higher mortality in the preceding weeks had coincided with the start of the COVID crisis. One month later the first publication using the term ‘excess mortality’ was published. This is the statistical term used in research to help grasp the number of extra deaths, for example during a heat wave or influenza epidemic and in this case the coronavirus pandemic. On 22 May 2020 a first table was published with an estimate of how many people would have been expected to die from various causes in the absence of the coronavirus pandemic. This table was to be updated and published weekly from then on.
Faster statistics
Many statistics were processed and published faster than usual, for example the number of bankruptcies pronounced in courts, and sick leave rates. For some health statistics the frequency was raised from yearly to quarterly. New statistics were developed to evaluate COVID-related policy measures, such as the uptake of financial support schemes for businesses like Tozo (Self-employment income support and loan scheme), TOGS (Compensation scheme for businesses in sectors affected by COVID-19) and NOW (Temporary emergency scheme for job retention).Survey challenges
As the lockdowns and contact restrictions soon started to cause problems for CBS interviewers visiting households to collect information, changes had to made to the statistical programme. In other developments, hairdressers had to close shop, so their prices could not be observed for the consumer price index (CPI). The same gradually became true for more and more goods and services which were temporarily no longer on offer. As a result, the CPI had to be calculated with estimates for the missing components. This workaround was also used by other national statistical offices in consultation with Eurostat, the statistical office of the EU. By using these methods, CBS managed to continue publishing the CPI.Assessment of effects based on the Health survey
To establish just how CBS statistics had to be adapted because of the effects of coronavirus and the measures taken during the pandemic, CBS researcher Jan Willem Bruggink was asked to use the case of the Health survey to evaluate how the planned programme of statistics was changed, and what the basis was of the publication strategy during the coronavirus period. Bruggink stresses that to be able to continue to deliver reliable statistics in an extreme setting like a pandemic – which you can reasonably expect to affect observation – it is crucial to adapt the survey process as quickly as possible. ‘For the Health survey this meant three things: how could we compensate for the loss of part of the information? Could we publish results more frequently? And should survey questions be changed, and if so: how?’Lower response corrected for by time series analysis
Between March 2020 and January 2022, contact and visiting restrictions meant that household interviews were often not possible. As a result, a significant part of the normal survey observations were not available. Respondents were given the option to take part in the surveys online, but this resulted in little extra response. Overall, the missing share of input from household interviews resulted in a ten percent lower response to the Health survey on a yearly basis. An added setback was that household interviews often reach people with different characteristics than online surveys. To correct reliably for this non-response, CBS was able to make use of its experience with time series analysis. Bruggink: ‘From results in previous years we knew how response to questions in the Health survey differed between home interviews and online surveys. We used this knowledge to correct the results for the period during which no home interviews were possible. We did this for eight variables and on a quarterly basis. These quarterly outcomes were subsequently included in the weighting model for 2020 and 2021. Other variables than the eight for which the time series models were constructed also benefited from the correction. We were able to apply these correction methods here because the period without household interviews was relatively short and ample data were available from previous years.’
Extra questions on impact of coronavirus
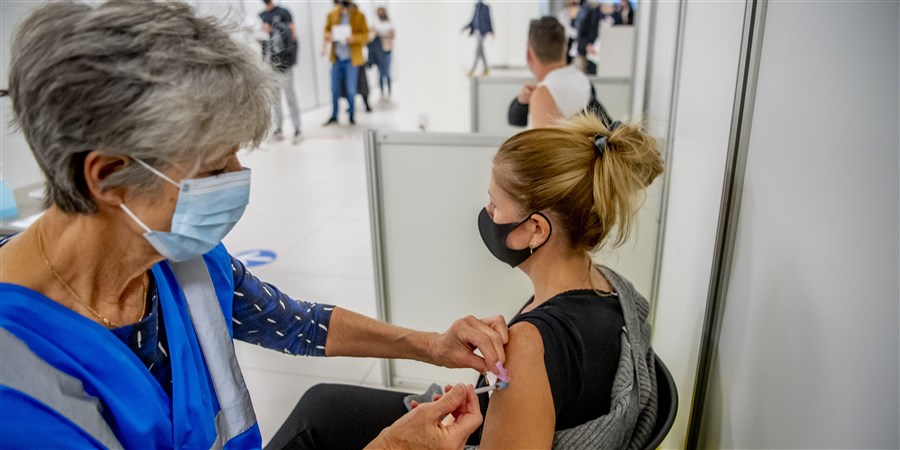
To be able to monitor the impact of coronavirus more accurately, from August to December 2020 extra questions were added to the Health survey. Respondents were asked whether they had or had had COVID, and if so how ill they were or had been. Questions were also included to find out how COVID had affected feelings of loneliness, anxiety, depression and stress. Other aspects covered were effects on behaviour: working situation, lifestyle (exercising, sports, substance use, nutrition) and use of health care. The questions were drafted in consultation with the municipal health services (GGDs) and the National Institute for Public Health and the Environment (RIVM), which also conducted their own coronavirus research and with whom the CBS collaborates on the Health monitor. In this way the three institutes were able to publish consistent information. The Health monitor is a four-yearly publication, but to gain a quicker insight into the potential impact of coronavirus on public health, lifestyle and perceived well-being, an extra edition was published in 2022, two years earlier than planned. The results from the coronavirus-related questions added to the CBS Health survey in the period August to December 2020 were already able to be published in 2021. The 2021 Health survey included questions on willingness to be vaccinated, although these were withdrawn fairly soon afterwards as the vaccination campaign gained momentum and figures became available on actual numbers of people vaccinated.The need for more frequent figures on health in the coronavirus period was mainly expressed by external stakeholders such as the Netherlands Institute for Social Research (SCP), the National Institute for Public Health and the Environment (RIVM) and the Ministry for Health, Welfare and Sport.
Related items
- News - Three years of COVID-19 in figures
- Dossier - Coronavirus crisis FAQs
- Article - The importance of reliable data in times of crisis
- CBS privacy regulations - Privacy