Mapping the value of our natural landscape
Woodland, heath or built-up areas
The new method breaks down the Netherlands into ecosystem types – for example woodland, heathland, agricultural land, beaches and residential areas – and maps the use of nature by people. Literally, by drafting maps and drawing in the areas and the services. Bogaart: ‘For each type of area, we look at the quality of the ecosystem and the ecosystem services that are useful for people. We also assign economic values to these services. To do this, we have selected services for which we can use data to determine the value, for example logging, recreation or climate regulation. Some services that may be important are not included because we don’t have any data about them – picking blackberries for example.The method was tried out with the ecosystem services for 2006, 2013 and 2018 and these were successfully turned into maps. Bogaart: ‘The plan is to do this with a fixed frequency, for example every two years. The ideal frequency will be decided in a European context.’
Landscape developments through time
‘By dividing the Netherlands into ecosystem types, you can also see how land use has changed in the course of time.’ says De Jong. ‘That is interesting in the context of the discussion on climate change and sustainable farming. Areas that are drying out or becoming wetter, urbanization; you can see all these developments in the natural capital accounts. More paved areas can result in less water being able to drain away and may cause flooding. Therefore it is important to study these developments in relation to each other. Because we draw maps for the natural capital accounts, we can examine the developments in each area. This gives us unique information.’Nature is essential for society
Joop van Bodegraven of the Ministry of LNV, who commissioned the study, is also involved in the project. ‘The interest in natural capital is a result of the discussion on the broader vision of well-being’ he says, ‘We have been talking about the social value of nature for ten year now, but in practice this value has been difficult to measure. Nature has many different functions, but they were certainly not all included in policy-making. The natural capital accounts can change that.’ This ministry considers nature to be essential for society: ‘By using objective data we can make sure that the value is recognised and get an insight into how the value develops.’The natural capital accounts are also used as input for the Monitor of Well-being, and the regional breakdown of the figures can be used to analyse local processes and to underpin regional plans, for example to develop the countryside. ‘The data we have compiled this year give the first good picture of natural capital across the whole of the Netherlands. We plan to link these to current policy dossiers, for example our forestry strategy. This strategy states that we want to realise more forest and also specifies what functions this should have. The natural capital accounts can help in working out these plans.’
Measuring the Sustainable Development Goals
Linking the ecosystem services to CBS economic and sustainability statistics results in valuable information, concludes De Jong. ‘We can see how much nature is affected by humans. This is important from the perspective of the SDGs. One of the goals of SDG 15, for example, is to protect, restore and promote sustainable use of ecosystems and halt biodiversity loss. SDG 2 includes the goal of sustainable food production, which helps conserve ecosystems.’There are strict international agreements on how to measure the SDGs. De Jong: ‘That’s what makes them such a powerful instrument. Now we have a good measurement system for natural capital, we want to enrich the official measurement with this information in as far as it is relevant for the Netherlands. This is being discussed by the UN organisations concerned.’
Hedges help animals
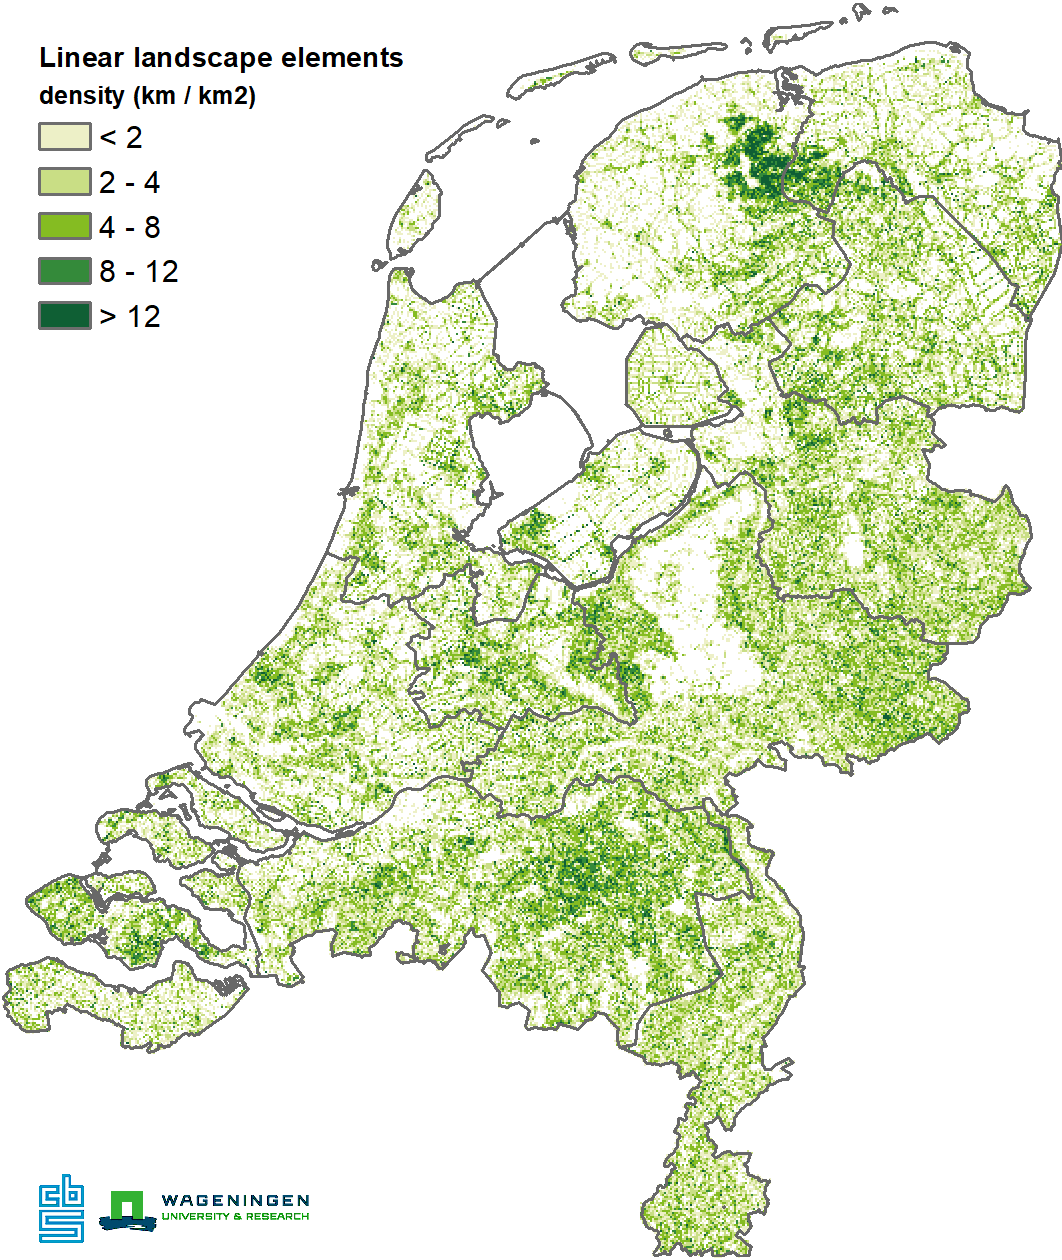
The presence of linear landscape elements such as hedgerows, wooded banks, canals and tree rows is an important quality indicator of the Dutch landscape. These elements can make landscape visually attractive, but they also play a large part in biodiversity, as they are resting places and roaming routes for wild animals and can play an important part in pollination and natural pest control. The density of hedges and tree rows on the map is expressed in terms of kilometres length per square kilometre of landscape. As a result of land reparcelling in the past many wooded banks were removed. Areas where this was less common can clearly be seen on the map, for example in Friese Wouden in the north of the country.Dutch status report on the SDGs
On 3 July, CBS publishes the update of the SDGs in the Netherlands and the English translation of the Monitor of Well-being & the Sustainable Development Goals 2020.Related items
- Publication - Monitor of well-being & the SDGs 2020