Deep learning for solar panel detection
Introduction
Solar power is an important source of renewable energy. Therefore, in several projects, Statistic Netherlands carries out research with which we can improve the estimate of the total amount of solar energy generated in the Netherlands. One of these projects is Deep Solaris. In this project, we evaluated several Deep Learning methods to automatically recognize solar panels in aerial photographs.Deep Solaris
The DeepSolaris project investigated the possibility of training models that could be used throughout Europe. With our partners Statbel in Belgium, IT.NRW and Destatis in Germany, and the Open University of the Netherlands, we investigated whether models that were trained on one country, could also be applied to another. The focus was on the Euregio (the province of Limburg in the Netherlands, Flanders in Belgium, and North Rhine-Westphalia in Germany). The highest resolution photos (10 cm per pixel) were only available for Limburg and North Rhine-Westphalia. For both areas, we used the 2018 aerial photograph, as well as additional administrative data. In the Netherlands, this administrative data consisted of data based on the PIR energy register and data obtained from the VAT returns applicable to solar panel installations. In North Rhine-Westphalia, the LANUV register (Landesamt für Natur, Environment and Consumer Protection North Rhine-Westphalia; i.e. the organisation for Nature, Environmental and Consumer protection for the state of North Rhine-Westphalia) was available. Both registers contain the addresses and also the geo-locations of the solar panels, that were known for the specific geographic areas used.Training and Evaluation
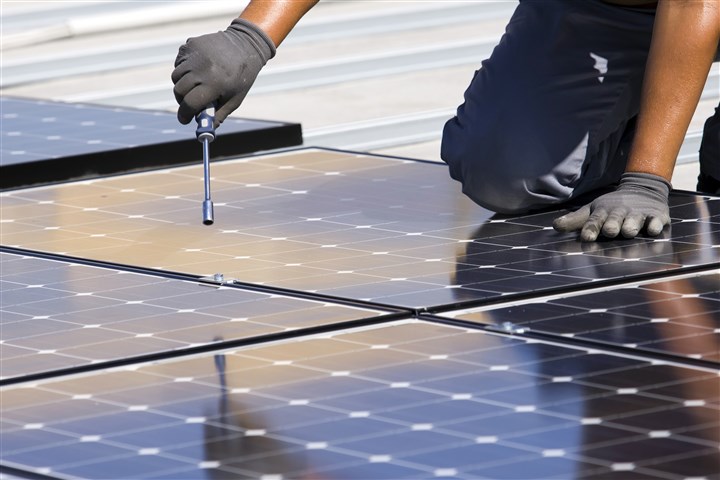
In this article, we focus on the classification model that was trained and evaluated on the South Limburg region. For this, we used the VGG16 deep learning model from the Visual Geometry Group at Oxford University. To this end, the model was adapted to our specific goal of identifying solar panels and then trained through so-called 'transfer learning' with photo cutouts of 200x200 pixels (20m by 20m) for Heerlen region. To evaluate how well the trained algorithm performed, we used cutouts from the nearby Valkenburg area (a more rural area). One way to evaluate the performance of the model is to compare the model predictions with the available register data and human-given labels (the annotations). This makes it clear when the model gives a correct prediction and when it gives an incorrect prediction.Comparison with available administrative data and annotations
To find out how well the trained model detects the presence of solar panels in a picture, we can compare the prediction with the information in the registers and with man-made annotations. This is a bit more complex than it might seem at first glance. For example, using the register data we can deduce the addresses at which a solar panel is present. However, this address may appear in multiple photo cutouts; for example, when it is a large property or when the building is exactly on the edge of two or more cutouts. Conversely, a cutout may contain multiple addresses. The results
from one cutout (whether or not there are solar panels) thus cannot be compared 1-to-1 with the register information.
For the human annotations, their quality depends on the person performing the annotations and the visibility of the solar panels in the cutouts. For instance, solar panels can be overseen or in other cases it may be difficult to determine whether solar panels are present in the cutout or not; for example, some cutouts may contain a lot of shadow or a skylight that looks very much like a
solar panel. Ideally, a cutout should be annotated by multiple people to determine when there is sufficient certainty that there is a solar panel in the cutout. An important question here is: how many people are needed for this and how many of them should agree with each other? Finally, the last complication is that the model also does not make a discrete choice between solar panel/no solar panel. The model instead provides values between 0 and 1, and thus a cutoff value must be chosen below which we assume that no solar panels are present in the cutout, and above which we
assume that solar panels do exist.
Thus, in order to make a direct comparison for each cutout, certain assumptions must be made. For example, one assumption we made was that the human-made annotations are correct. In this way, we can compare both the prediction and the register data with these annotations. What is more, to assign a register label to each cutout, we have chosen to use the fraction of the building with the solar panels, that is present in the cutout. For this purpose, we have chosen a cutoff value that makes the register labels correspond as much as possible to the labels of the annotations. For the model, we have used a cutoff value of 0.5.
Based on these assumptions, the figure below compares the predictions of the model with the label derived from the register and at the same time with the label derived by the people that made the annotations. In the case of an agreement between all labels, we can assume that all three of the labels are correct. As shown in the figure below, the labels match in nearly 88% of the cases. The majority of the labels (around 43000) are negative, about 3500 labels are positive. In about 12% of the cases, one of the three labels is off. Thus, three different possibilities can be distinguished in which one of the categories differs from the other two:
• The annotation and register label are the same, but the model prediction differs
(4.75% in the chart below)
• The annotation and model prediction are the same, but the register label differs
(5.36% in the chart below)
• The register label and the model prediction are the same, but the annotation differs
(1.91% in the chart below)
A comparison of the annotations, register labels and predictions of the vgg16 model.
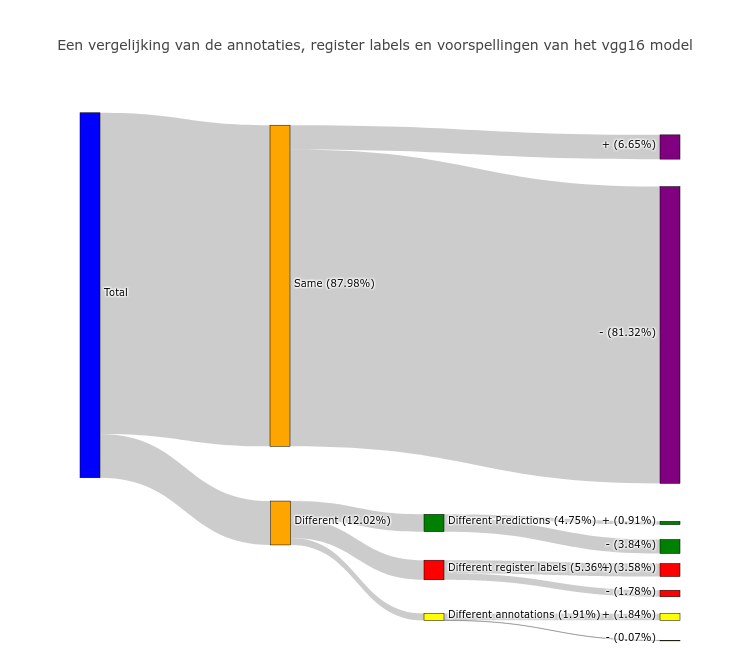
For the first category, in which the model predictions differ from the annotations and the registry labels, we see that the model overwhelmingly (3.84% compared to 0.91% of the total) predicts a negative label. Thus, the model has a tendency to give more negative predictions. If we look at the labels given by the human annotators, we see that the majority of annotations are consistent with each other. In the vast majority of cases, therefore, the model will therefore be wrong in this case. Because in this case, it generally involves cutouts with a positive label, it is interesting to see why the model makes a wrong prediction here. In order to make the model handle these cutouts better in the future, the model can be trained further by giving these particular cutouts a greater weight or we can offer the cut-outs more often to the model.
For the second category, where the register label differs from the other labels, we see that the register label here is predominantly positive (3.58% compared to 1.78% of the total). Again, the majority of people agreed about the annotation label. The positive category is interesting because it may include cutouts to which a positive label has been given based on the register. On the one hand, it may involve a building with solar panels but where these solar panels are located in a different cutout. On the other hand, these may also be addresses in the register that no longer contain any solar panels. The negative category is also interesting, because it may indicated solar panels that are missing from the register altogether.
For the last category, both the registry and the model predictions differ from the annotation. A majority of annotation labels are positive (1.84% positive compared to 0.07% negatives). In the vast majority of the cases (885/1006), these are annotations for which the people who annotated the cutout agree with each other. In the remaining cases (121/1006), there is a major disagreement about the correct annotation. These are therefore cut-outs for which it is difficult to see if there are actually solar panels in it. Several interpretations are possible here. On the one hand, it could be incorrect annotations. In this case, the register label and the model provide additional information that can be used to still give a label to cutouts that may be difficult to interpret by the human annotators. On the other hand, it may also be that both the model predictions and the register label are wrong here. This last category is particularly interesting because most of the annotations are positive and so it may be solar panels that are not present in the register.
The negative register labels from the second category and the positive annotation labels in the third category, provide information about installations that may be missing from the register.
Because the 2018 aerial image is taken during a long period during the spring and summer and therefore it is not possible to determine exactly which part of the photograph was taken when, we compared the high-resolution photo from 2018 with the registry data up to the end of December 2017, as well as the low-resolution aerial photo from 2017. We have made this comparison only for the areas mentioned above in South Limburg. Panels found in 2018, not present in the register and not appearing in the 2017 aerial photograph are then all-new panels. Panels found in 2018, not present in the register but, conversely, can be seen in the 2017 aerial photograph, are panels that are not present in the register. The other way around is also possible: panels present in the register may not be present in the aerial photograph. These may be panels that for example, were removed from the rooftop during a move. During this analysis, 760 new solar panels were discovered that were not part of 2017 register. These panels were therefore added in late 2017, after the aerial photograph was taken, or in 2018. Also, 449 solar panels were discovered that were shown on both the 2018 aerial photo and the aerial photograph of 2017, but were missing from the register.
Preliminary Conclusion
The results show that it is possible to use deep learning techniques, specifically the VGG16 model, to recognize solar panels in aerial photographs. It is also possible to use these models to discover solar panels that were not present in the registers. Therefore, by using these models, applied to the aerial photographs, existing registers can be enriched. Deep learning models are thus an interesting tool for official statistics, but before this tool can be used, a number of questions still need to be answered.To be continued
Even though the DeepSolaris project has ended, the research into the detection of solar panels in aerial photos will continue within Statistic Netherlands. In order to produce official statisticsfrom Deep Learning algorithms we have to look at the entire chain of dataset, annotation, model to prediction and finally statistics. In training and evaluating a model, firstly it is important that the dataset is a good representation of reality; a dataset should be a good sample of the entire population. The quality of the annotations is also important: by annotating each cutout by multiple
people, something can be said about the certainty of these annotations. Second, the robustness and reliability of the models is important to consider; how well does a model trained on South Limburg work over the Randstad area near Amsterdam. Third, we want to look at alternative metrics for evaluating the performance of the models. Measures such as precision, accuracy and the F1 score are strongly influenced by an imbalance in the dataset. Because the number of homes with solar panels in the Netherlands is still much smaller than the number of houses without solar panels, we are dealing with a strong imbalance in the datasets. By using metrics that capture this imbalance, we can provide a fairer and more reliable measurement of the performance of our models. Finally, we also want to start looking at object detection models, which can be used to derive the location, size and number of panels. Based on this data, we can create more detailed statistics than on the basis of the classification models.
Privacy measures
Statistics Netherlands always publishes data in such a way that no recognizable data about an individual person, household, business or institution can be derived. Although in this project, public data (aerial photographs, satellite images) is used as basis for the analysis, the interactive maps will only show the numbers of solar panels at an aggregate level .Recognition
This research is conducted under the ESS action 'Merging Geostatistics and Geospatial Information in Member States' (grant agreement no.: 08143.2017.001-2017.408) and a Statistic Netherlands investment for the development of Deep Learning algorithms. For more information on Statistic Netherlands's efforts to improve its solar power statistics, see the publication 'Smart solar mapping' and the publication 'Automatically detecting solar panels with aerial photos'.