Value of agricultural exports up by over 8 percent in 2025
| Jaartal | Exports of goods produced in the Netherlands (billion euros) | Re-exports (billion euros) |
|---|---|---|
| 2016 | 60.2 | 22.4 |
| 2017 | 63.6 | 24.1 |
| 2018 | 64.1 | 24.1 |
| 2019 | 66.9 | 25.3 |
| 2020 | 66.5 | 26.6 |
| 2021 | 68.2 | 34.9 |
| 2022 | 79.2 | 42.6 |
| 2023 | 79.6 | 43.4 |
| 2024 | 82.0 | 44.9 |
| 2025¹⁾ | 88.4 | 49.1 |
| Source: CBS, WUR | ||
| ¹⁾ The figures over November and December are estimates. | ||
Over two-thirds of the increase in the value of agricultural exports was due to rising prices in 2025. The remainder increase was attributable to a rise in the volume of agricultural goods exported.
The Dutch economy is estimated to have earned over 49 billion euros in 2025 from the export of these products. Of that total, 43.5 billion euros came from agricultural goods produced in the Netherlands and 5.7 billion euros came from the re-export of these goods produced in other countries.
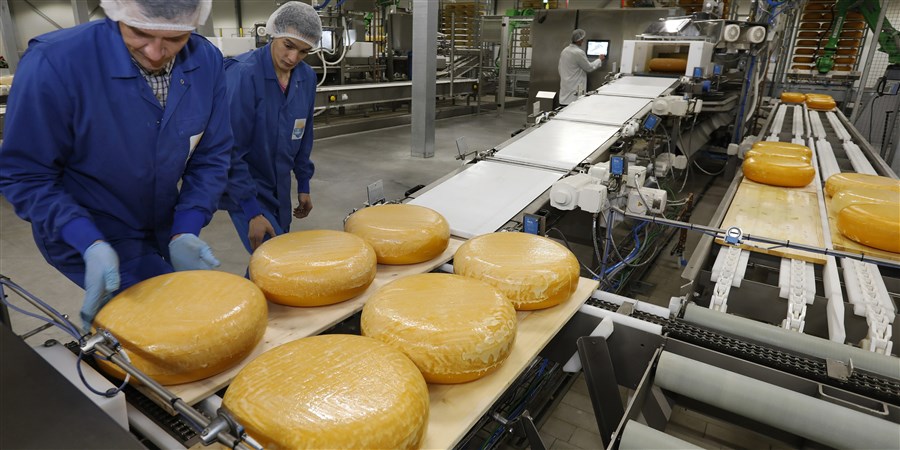
Dairy products and eggs once again the main export products
The export value of dairy and eggs (13.3 billion euros) and of meat (12.1 billion euros) increased by 10 percent, while the value of horticulture exports, such as bulbs, cut flowers, plants and tree nursery products rose by 4 percent compared with 2024.Sharp increase in export value of cocoa products
A very sharp increase in the price of cocoa led to an increase in the export value of cocoa and cocoa preparations (cocoa butter, cocoa paste, cocoa powder and chocolate). Exports worth 12.4 billion euros crossed the border, an increase of 35 percent compared to 2024.Cocoa products are now the second-largest Dutch agricultural export product, while in 2023 this product group ranked in eleventh position.
The high price of cocoa is the result of several years of poor harvests in West Africa due to unfavourable weather conditions. The costs of crop protection products and fertilisers also rose, making them unaffordable, particularly for smaller farms. This led to diseases in agricultural crops and tree mortality.
| Categorie | 2025¹⁾ (billion euros) | 2024 (billion euros) |
|---|---|---|
| Dairy products and eggs | 13.3 | 12.1 |
| Cocoa (and cocoa preparations) | 12.4 | 9.2 |
| Horticultural products | 12.3 | 11.8 |
| Meat | 12.1 | 11.0 |
| Fruits | 9.6 | 8.1 |
| Vegetables | 9.4 | 8.9 |
| Processed and preserved fruits and vegetables | 7.3 | 7.2 |
| Beverages | 7.2 | 7.1 |
| Preparation of cereals, flour, milk | 7.1 | 6.6 |
| Natural fats and oils | 6.6 | 6.3 |
| Source: CBS, WUR | ||
| ¹⁾ The figures over November and December are estimates. | ||
Significant growth in exports to EU countries
Germany has traditionally been the main buyer of agricultural goods from the Netherlands. In 2025, 25 percent in agricultural exports went to Germany. The value of Dutch agricultural exports to Germany rose by 10 percent in 2025.Exports to Belgium and France grew slightly less, at 7 percent. Exports to Poland saw the highest growth of all the top-ten export destinations, in percentage terms, with a rise of 24 percent in 2025.
Dutch exports outside EU show slower growth
Exports of agricultural goods to non-EU countries increased less sharply. For example, exports to China grew by 5 percent less in value than in previous years. This was partly due to a slight decline in pork exports to this country. Exports of baby milk powder to China, on the other hand, increased slightly.
Agricultural exports to the UK also increased by 5 percent less than average, which may be due to the impact of Brexit. Finally, exports to the US, which are under pressure from the increased import tariffs imposed, grew by only 3 percent in value.
| Bestemming | 2025¹⁾ (billion euros) | 2024 (billion euros) |
|---|---|---|
| Germany | 34.0 | 31.0 |
| Belgium | 16.9 | 15.8 |
| France | 11.4 | 10.6 |
| UK | 9.8 | 9.4 |
| Spain | 5.7 | 4.9 |
| Italy | 5.6 | 5.0 |
| Poland | 5.2 | 4.2 |
| US | 3.8 | 3.7 |
| Sweden | 3.1 | 2.6 |
| China | 3.0 | 2.9 |
| Source: CBS, WUR | ||
| ¹⁾ The figures over November and December are estimates. | ||