Investigative study on new statistics on home delivery services
In recent years, many companies have expanded their services to include home delivery, especially during the coronavirus pandemic. In addition, many new companies have entered the market, focusing on delivering both goods and, for example, meals or groceries. As a result, more and more delivery vans, mopeds, and bicycles make use of the road. These rapid changes have created a need for better statistics on home delivery services, allowing for policymakers, academics, and urban planners to improve dealing with these new challenges. In a project co-funded by Eurostat, Statistics Netherlands investigated how statistics on home delivery services could be created.
What did we do?
In collaboration with several companies offering delivery services, we investigated various aspects of home delivery. Aspects such as "Which categories of delivery companies can be distinguished?" and "Which types of vehicles should be distinguished for this purpose?" were examined. We investigated what information is needed, as well as whether and how this information could be obtained without imposing excessive administrative burden on the companies. Based on existing data, we investigated how companies could be placed in a home delivery category, whether these companies actually offer delivery services, and whether it is possible to determine how many vehicles with license plates are used by the various types of companies. Also, a pilot study was performed to see whether it is possible to determine how many bicycles are used for home deliveries. This poses an extra challenge, as bicycles do not have license plates.
Results
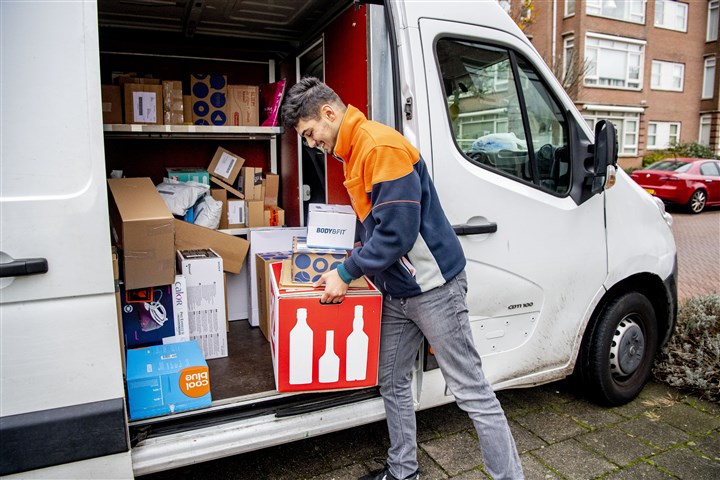
The three largest categories in delivery services are parcel delivery, grocery delivery (supermarkets), and meal delivery. The vehicles used for delivery services are divided into 7 categories: bicycles, mopeds, motorcycles, compact distribution vehicles, cars, delivery vans, and trucks. Subsequently, a method was developed to assign the number of vehicles with license plates to the various categories of delivery services. However, this proved difficult without additional information being requested from the companies. Likewise, developing a method to determine the number of bicycles used for home delivery also proved a challenge without extra information.
This research has not yet resulted in actual statistics. Although the work on bicycle delivery proved to be a challenge, we have taken important steps forward for future statistics on home delivery services. We have examined various data sources, developed methods, and we have prepared for future steps in mapping out home delivery services (e.g., transport performance). This information is also relevant for statistical offices in other countries.
Information
For more information about this research, please email GoederenVervoer2@cbs.nl.
Co-funded by the European Union under call SMP-ESS-2022-TRANSPORT-STATS-IBA —New transport statistics

Disclaimer: Co-funded by the European Union. Views and opinions expressed are however those of the author(s) only and do not necessarily reflect those of the European Union or Eurostat. Neither the European Union nor the granting authority can be held responsible for them.