Imputation method vehicle kilometers
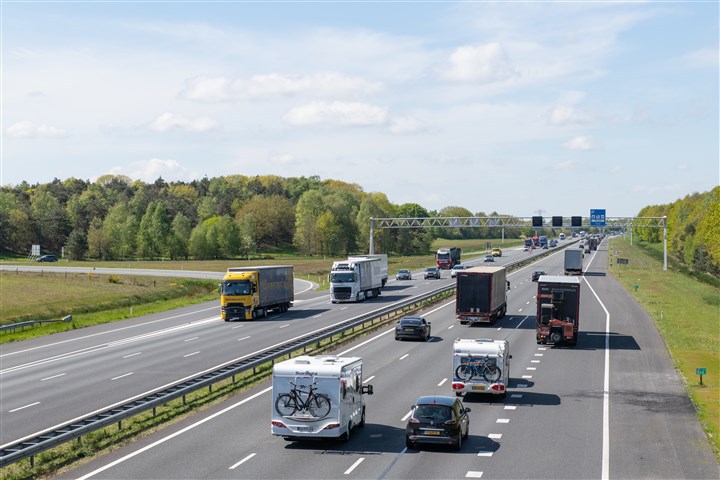
The Traffic Performance statistic relies on accurate yearly vehicle kilometers for all Dutch registered vehicles (passenger cars, vans, freight vehicles and buses). These are calculated for a large part based on odometer readings. The Traffic Performance statistic serves as input for many other statistics, including vehicle emission calculations. However, sufficient odometer readings are not available for every vehicle. For instance, temporarily suspended vehicles, newly registered young vehicles, and oldtimers often lack a logical sequence of readings. How can these missing values be estimated without introducing bias? And how can the process move away from outdated scaling methods toward a more robust solution?
What did we do?
Historically, Statistics Netherlands handled missing data by applying an "increment factor" to scale the available kilometers to the total population. This method was designed when only a sample of odometer readings was received. Since 2012, Statistics Netherlands receives all registered odometer readings, providing sufficient data for over 85% of all vehicles to make an estimate, with up to 91.3% for passenger cars. The increment method limits the ability to provide detailed breakdowns by region or other characteristics that are increasingly requested, and it makes the underlying data harder for external researchers to use.
Methodologists at Statistics Netherlands recommend imputation as an alternative method, and Eurostat also indicates that imputation is the preferred method compared to using an increment factor. In this report, two overarching methods are explored: imputing single values per strata (mean imputation and median imputation) and using a donor based imputation approach (random hot deck and sequential hot deck). To evaluate their performance, missing data was simulated by splitting the response data into an 80% training set and a 20% test set. The methods were compared using group-level performance metrics and visual validations.
Results
The analysis shows that the random hot deck method performs best. Unlike simple mean or median imputation, this donor-based approach preserves the distributional properties of the data more effectively.
Based on these findings, the random hot deck method will be used to produce the Traffic Performance statistic for all vehicle types. Each vehicle type has its own selection of strata variables (examples are year of construction, weight class, fuel type, and owner type), allowing for scalable and tailored handling of missing values.
Implementing this method improves the reliability of the Traffic Performance statistic and provides higher-quality empirical data for internal and external researchers. A report detailing the methodology, the comparison of imputation methods, and the results, focused on passenger cars, is available below.
Co-funded by the European Union under call SMP-ESS-20240TRANSPORT-STATS-IBA

Disclaimer: Co-funded by the European Union. Views and opinions expressed are however those of the author(s) only and do not necessarily reflect those of the European Union or Eurostat. Neither the European Union nor the granting authority can be held responsible for them.