An innovative way to estimate solar energy yields
New data sources
CBS maintains a register of certain basic characteristics of photovoltaic (PV) systems, the most relevant of which are location and capacity. This register is updated periodically to ensure that the growth in the number of PV systems is reflected in the statistics, keeping CBS informed of the total installed capacity and making it possible to estimate how much solar energy is being generated.In addition to technical specifications, the yield of PV systems also depends heavily on the weather, such as solar radiation levels, wind, temperature and humidity. The yield also varies throughout the day and according to the time of year. Finally, environmental factors such as shadows from chimneys, dormer windows, trees and buildings can cause yields to vary greatly over the course of a given day.
To include the effects of all these factors in its calculations, CBS uses data on the actual electricity generation of PV systems. These data are already available for some of the larger installations in the Netherlands. Where an installation’s actual electricity generation is unknown, it is calculated using an average yield. This average is then corrected for the sunlight measured in that period and region, based on publicly available daily measurements from around 30 weather stations operated by the Royal Netherlands Meteorological Institute (KNMI).
Although the current figures have already been corrected for solar radiation, the relationship between that radiation and electricity production is not linear. For example, the electricity generated for the same radiation level is lower at a high ambient temperature than at a low temperature. There is also a limited density of measuring stations across the country. In order to include the effects of these and other factors in the calculations, new and additional data sources were explored to improve the estimates. This study used two new data sources, which are explored below.
Radiation data from satellites
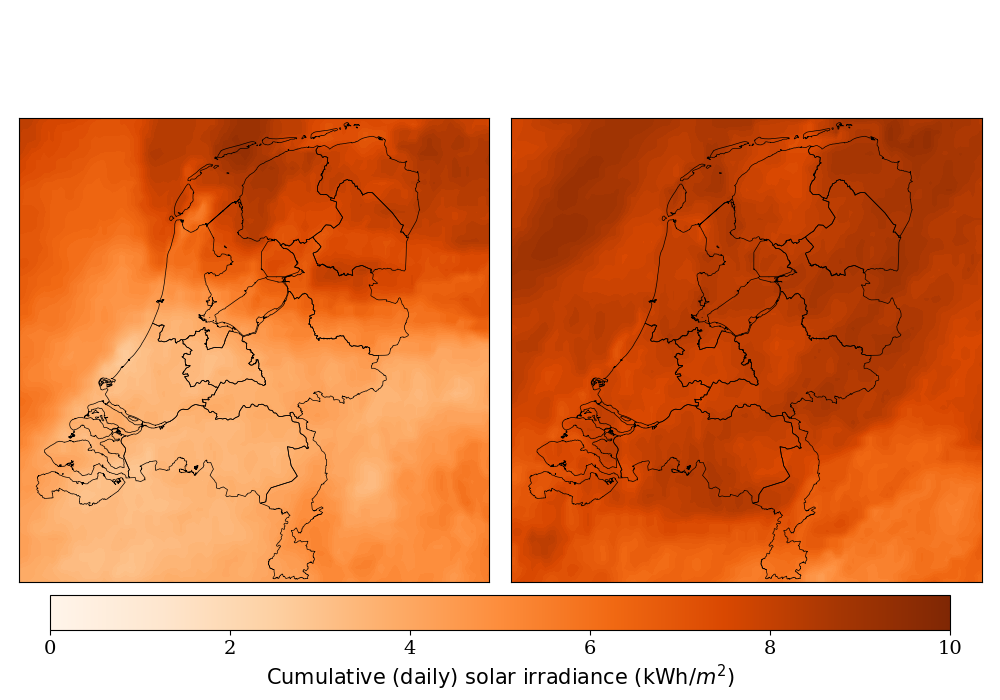
The first data source involves radiation data. The KNMI calculates the amount of radiation in the Netherlands based on observations from the Meteosat satellite. The modelled radiation data are available for each 15-minute period for areas measuring three by six kilometres. This information allows for the formation of a detailed picture of the times and areas in the Netherlands that received more or less radiation. The figures below show the radiation received on 21 and 22 June 2016 and highlight the significant differences in received radiation that can arise on different days and in different parts of the Netherlands.
PVOutput data portal
The second data source is the international data portal at pvoutput.org. A large number of private individuals and organisations have registered their PV systems with this portal, which shows them how their systems are performing. The solar panel yields are generally measured every five minutes for each connected system, and there are approximately 5,500 connected installations in the Netherlands. This study analysed these measurements. Strict validation checks have been defined so as to exclude measurements that are less reliable, for example due to a temporary break in the connection. On average, about 1,200 systems are used in the calculations each day. The attached figure shows an annual pattern of measurements from one of these installations over the course of 2016. At this installation, the highest yields were achieved between the end of May and the beginning of July from approximately 13:00 to 17:00. Different individual installations have different yield patterns.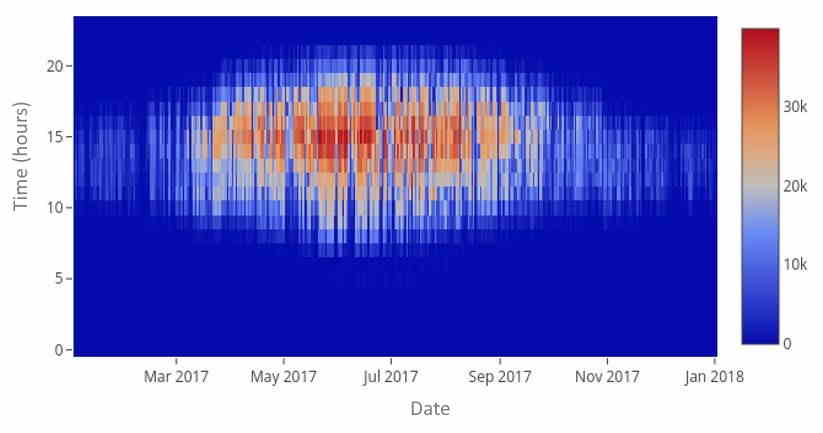
New method
The new method uses the two data sources to statistically map out the solar power yield for the whole of the Netherlands, based on the measurements from PVOutput and taking into account the radiation calculated by the KNMI. To this end, both data sources are linked on the basis of location, making it possible to obtain the total radiation and total solar power, normalised by system size, day and location. This relationship is then used to calculate the most likely daily yield. For a more detailed description of this innovative method, which was developed in collaboration with Professor van Sark from Utrecht University, please read the pre-print of the paper.Solar power per day for the whole of the Netherlands
The figure below gives the solar power yield for the whole of the Netherlands in 2016. It clearly shows that the actual yield varies greatly from day to day, with summer yields being on average higher than winter yields, as might be expected. The yield on a clear day in summer can be up to ten times higher than on a grey winter’s day. On the other hand, some winter days, for example in early February, actually saw higher yields than on an unfavourable summer day such as those in mid-May.
| month,day,energy Jan,1,1.39 Jan,2,0.54 Jan,3,0.63 Jan,4,0.46 Jan,5,0.41 Jan,6,0.43 Jan,7,0.4 Jan,8,2.52 Jan,9,0.6 Jan,10,2.02 Jan,11,0.4 Jan,12,0.86 Jan,13,0.72 Jan,14,0.66 Jan,15,0.47 Jan,16,1.54 Jan,17,2.83 Jan,18,2.92 Jan,19,1.91 Jan,20,1.09 Jan,21,0.82 Jan,22,2.01 Jan,23,1.68 Jan,24,0.41 Jan,25,3.19 Jan,26,1.47 Jan,27,0.4 Jan,28,3.9 Jan,29,0.43 Jan,30,0.4 Jan,31,0.72 Feb,1,0.58 Feb,2,1.06 Feb,3,2.62 Feb,4,0.49 Feb,5,0.47 Feb,6,0.72 Feb,7,2.26 Feb,8,1.91 Feb,9,0.43 Feb,10,1.63 Feb,11,3.53 Feb,12,2.19 Feb,13,2.22 Feb,14,0.43 Feb,15,3.84 Feb,16,5.76 Feb,17,5.57 Feb,18,2.08 Feb,19,3.91 Feb,20,0.56 Feb,21,0.45 Feb,22,0.72 Feb,23,3.72 Feb,24,4.36 Feb,25,3.8 Feb,26,2.45 Feb,27,6.35 Feb,28,5.96 Feb,29,6.29 Mar,1,1.22 Mar,2,3.25 Mar,3,4.25 Mar,4,0.74 Mar,5,3.74 Mar,6,3.44 Mar,7,4.84 Mar,8,3.63 Mar,9,4.93 Mar,10,6.34 Mar,11,4.02 Mar,12,7.3 Mar,13,7.53 Mar,14,7.61 Mar,15,1.96 Mar,16,6.54 Mar,17,7.81 Mar,18,1.09 Mar,19,1.73 Mar,20,2.32 Mar,21,1.64 Mar,22,3.02 Mar,23,3.1 Mar,24,1.59 Mar,25,2.07 Mar,26,7.77 Mar,27,4.45 Mar,28,4.46 Mar,29,4.63 Mar,30,6.06 Mar,31,3.84 Apr,1,8.12 Apr,2,4.1 Apr,3,5.94 Apr,4,4.38 Apr,5,2.63 Apr,6,2.72 Apr,7,5.04 Apr,8,5.07 Apr,9,6.84 Apr,10,7.41 Apr,11,8.98 Apr,12,6.83 Apr,13,5.83 Apr,14,6.9 Apr,15,3.21 Apr,16,5.12 Apr,17,6.85 Apr,18,6.44 Apr,19,7.48 Apr,20,9.44 Apr,21,9.78 Apr,22,6.86 Apr,23,6.8 Apr,24,7.34 Apr,25,3.39 Apr,26,4.97 Apr,27,5.85 Apr,28,6.61 Apr,29,4.42 Apr,30,6.18 May,1,9.41 May,2,8.74 May,3,9.24 May,4,8.99 May,5,10.68 May,6,10.01 May,7,9.63 May,8,10.29 May,9,9.96 May,10,4.88 May,11,8.76 May,12,9.63 May,13,10.13 May,14,6.74 May,15,6.64 May,16,5.99 May,17,7.19 May,18,5.35 May,19,6.78 May,20,3.46 May,21,6.85 May,22,2.81 May,23,2.12 May,24,4.29 May,25,3.52 May,26,7.98 May,27,7.84 May,28,8.41 May,29,4.33 May,30,3.5 May,31,6.37 Jun,1,5.72 Jun,2,3.83 Jun,3,5.58 Jun,4,8.28 Jun,5,10.22 Jun,6,10.34 Jun,7,9.15 Jun,8,8.76 Jun,9,10.06 Jun,10,9.16 Jun,11,5.61 Jun,12,5.08 Jun,13,4.53 Jun,14,5.2 Jun,15,5.74 Jun,16,7.66 Jun,17,6.03 Jun,18,5.1 Jun,19,7.74 Jun,20,2.19 Jun,21,4.88 Jun,22,8.17 Jun,23,6.6 Jun,24,6.08 Jun,25,3.72 Jun,26,7.26 Jun,27,3.92 Jun,28,7.29 Jun,29,7.02 Jun,30,3.64 Jul,1,2.81 Jul,2,8.62 Jul,3,8.67 Jul,4,8.96 Jul,5,4.47 Jul,6,9.49 Jul,7,8.46 Jul,8,4.47 Jul,9,7.35 Jul,10,9.1 Jul,11,6.4 Jul,12,6.92 Jul,13,5.69 Jul,14,7.62 Jul,15,8.76 Jul,16,4.38 Jul,17,8.27 Jul,18,10.5 Jul,19,10.48 Jul,20,9.46 Jul,21,9.34 Jul,22,6.48 Jul,23,7.23 Jul,24,7.53 Jul,25,5.19 Jul,26,7.77 Jul,27,5.47 Jul,28,5.74 Jul,29,5.34 Jul,30,5.16 Jul,31,6.54 Aug,1,7.48 Aug,2,3.09 Aug,3,2.73 Aug,4,5.65 Aug,5,7.81 Aug,6,7.46 Aug,7,5.37 Aug,8,7.21 Aug,9,7.03 Aug,10,8.41 Aug,11,2.24 Aug,12,4.26 Aug,13,5.45 Aug,14,6.97 Aug,15,9.12 Aug,16,9.12 Aug,17,10.87 Aug,18,10.18 Aug,19,6.55 Aug,20,7.66 Aug,21,4.61 Aug,22,3.62 Aug,23,9.26 Aug,24,10.01 Aug,25,9.82 Aug,26,8.52 Aug,27,8.85 Aug,28,6.54 Aug,29,6.26 Aug,30,9.54 Aug,31,9.53 Sep,1,6.96 Sep,2,6.03 Sep,3,6.62 Sep,4,4.85 Sep,5,7.36 Sep,6,6.59 Sep,7,9.48 Sep,8,9.12 Sep,9,8.28 Sep,10,8.85 Sep,11,4.23 Sep,12,8.65 Sep,13,8.49 Sep,14,8.42 Sep,15,8.0 Sep,16,4.4 Sep,17,3.94 Sep,18,5.54 Sep,19,4.81 Sep,20,5.36 Sep,21,6.95 Sep,22,5.34 Sep,23,7.25 Sep,24,7.97 Sep,25,7.2 Sep,26,5.23 Sep,27,8.43 Sep,28,6.41 Sep,29,1.71 Sep,30,5.48 Oct,1,4.24 Oct,2,2.92 Oct,3,5.76 Oct,4,5.53 Oct,5,8.4 Oct,6,4.52 Oct,7,2.72 Oct,8,4.79 Oct,9,5.22 Oct,10,5.27 Oct,11,3.19 Oct,12,2.01 Oct,13,2.99 Oct,14,4.01 Oct,15,1.71 Oct,16,6.96 Oct,17,3.78 Oct,18,1.8 Oct,19,2.98 Oct,20,1.64 Oct,21,3.07 Oct,22,3.34 Oct,23,4.51 Oct,24,1.19 Oct,25,1.8 Oct,26,2.96 Oct,27,1.82 Oct,28,0.62 Oct,29,4.7 Oct,30,3.18 Oct,31,4.87 Nov,1,1.61 Nov,2,3.85 Nov,3,2.58 Nov,4,1.84 Nov,5,2.28 Nov,6,2.12 Nov,7,0.79 Nov,8,2.26 Nov,9,0.75 Nov,10,0.89 Nov,11,3.85 Nov,12,2.32 Nov,13,0.55 Nov,14,0.88 Nov,15,0.53 Nov,16,1.49 Nov,17,1.63 Nov,18,1.68 Nov,19,2.07 Nov,20,0.75 Nov,21,0.56 Nov,22,2.5 Nov,23,0.96 Nov,24,2.52 Nov,25,4.12 Nov,26,2.2 Nov,27,1.86 Nov,28,4.23 Nov,29,4.15 Nov,30,1.99 Dec,1,0.56 Dec,2,1.47 Dec,3,2.7 Dec,4,3.85 Dec,5,3.79 Dec,6,3.25 Dec,7,0.81 Dec,8,1.31 Dec,9,0.68 Dec,10,0.61 Dec,11,1.08 Dec,12,0.63 Dec,13,0.54 Dec,14,1.21 Dec,15,0.8 Dec,16,1.81 Dec,17,0.55 Dec,18,0.86 Dec,19,2.01 Dec,20,1.75 Dec,21,1.04 Dec,22,0.61 Dec,23,0.91 Dec,24,1.12 Dec,25,0.55 Dec,26,2.21 Dec,27,2.81 Dec,28,0.75 Dec,29,1.97 Dec,30,2.14 Dec,31,0.64 | energy (solar energy (GWh)) | |
|---|---|---|
| Jan | 1 | 1.39 |
| Jan | 2 | 0.54 |
| Jan | 3 | 0.63 |
| Jan | 4 | 0.46 |
| Jan | 5 | 0.41 |
| Jan | 6 | 0.43 |
| Jan | 7 | 0.4 |
| Jan | 8 | 2.52 |
| Jan | 9 | 0.6 |
| Jan | 10 | 2.02 |
| Jan | 11 | 0.4 |
| Jan | 12 | 0.86 |
| Jan | 13 | 0.72 |
| Jan | 14 | 0.66 |
| Jan | 15 | 0.47 |
| Jan | 16 | 1.54 |
| Jan | 17 | 2.83 |
| Jan | 18 | 2.92 |
| Jan | 19 | 1.91 |
| Jan | 20 | 1.09 |
| Jan | 21 | 0.82 |
| Jan | 22 | 2.01 |
| Jan | 23 | 1.68 |
| Jan | 24 | 0.41 |
| Jan | 25 | 3.19 |
| Jan | 26 | 1.47 |
| Jan | 27 | 0.4 |
| Jan | 28 | 3.9 |
| Jan | 29 | 0.43 |
| Jan | 30 | 0.4 |
| Jan | 31 | 0.72 |
| Feb | 1 | 0.58 |
| Feb | 2 | 1.06 |
| Feb | 3 | 2.62 |
| Feb | 4 | 0.49 |
| Feb | 5 | 0.47 |
| Feb | 6 | 0.72 |
| Feb | 7 | 2.26 |
| Feb | 8 | 1.91 |
| Feb | 9 | 0.43 |
| Feb | 10 | 1.63 |
| Feb | 11 | 3.53 |
| Feb | 12 | 2.19 |
| Feb | 13 | 2.22 |
| Feb | 14 | 0.43 |
| Feb | 15 | 3.84 |
| Feb | 16 | 5.76 |
| Feb | 17 | 5.57 |
| Feb | 18 | 2.08 |
| Feb | 19 | 3.91 |
| Feb | 20 | 0.56 |
| Feb | 21 | 0.45 |
| Feb | 22 | 0.72 |
| Feb | 23 | 3.72 |
| Feb | 24 | 4.36 |
| Feb | 25 | 3.8 |
| Feb | 26 | 2.45 |
| Feb | 27 | 6.35 |
| Feb | 28 | 5.96 |
| Feb | 29 | 6.29 |
| Mar | 1 | 1.22 |
| Mar | 2 | 3.25 |
| Mar | 3 | 4.25 |
| Mar | 4 | 0.74 |
| Mar | 5 | 3.74 |
| Mar | 6 | 3.44 |
| Mar | 7 | 4.84 |
| Mar | 8 | 3.63 |
| Mar | 9 | 4.93 |
| Mar | 10 | 6.34 |
| Mar | 11 | 4.02 |
| Mar | 12 | 7.3 |
| Mar | 13 | 7.53 |
| Mar | 14 | 7.61 |
| Mar | 15 | 1.96 |
| Mar | 16 | 6.54 |
| Mar | 17 | 7.81 |
| Mar | 18 | 1.09 |
| Mar | 19 | 1.73 |
| Mar | 20 | 2.32 |
| Mar | 21 | 1.64 |
| Mar | 22 | 3.02 |
| Mar | 23 | 3.1 |
| Mar | 24 | 1.59 |
| Mar | 25 | 2.07 |
| Mar | 26 | 7.77 |
| Mar | 27 | 4.45 |
| Mar | 28 | 4.46 |
| Mar | 29 | 4.63 |
| Mar | 30 | 6.06 |
| Mar | 31 | 3.84 |
| Apr | 1 | 8.12 |
| Apr | 2 | 4.1 |
| Apr | 3 | 5.94 |
| Apr | 4 | 4.38 |
| Apr | 5 | 2.63 |
| Apr | 6 | 2.72 |
| Apr | 7 | 5.04 |
| Apr | 8 | 5.07 |
| Apr | 9 | 6.84 |
| Apr | 10 | 7.41 |
| Apr | 11 | 8.98 |
| Apr | 12 | 6.83 |
| Apr | 13 | 5.83 |
| Apr | 14 | 6.9 |
| Apr | 15 | 3.21 |
| Apr | 16 | 5.12 |
| Apr | 17 | 6.85 |
| Apr | 18 | 6.44 |
| Apr | 19 | 7.48 |
| Apr | 20 | 9.44 |
| Apr | 21 | 9.78 |
| Apr | 22 | 6.86 |
| Apr | 23 | 6.8 |
| Apr | 24 | 7.34 |
| Apr | 25 | 3.39 |
| Apr | 26 | 4.97 |
| Apr | 27 | 5.85 |
| Apr | 28 | 6.61 |
| Apr | 29 | 4.42 |
| Apr | 30 | 6.18 |
| May | 1 | 9.41 |
| May | 2 | 8.74 |
| May | 3 | 9.24 |
| May | 4 | 8.99 |
| May | 5 | 10.68 |
| May | 6 | 10.01 |
| May | 7 | 9.63 |
| May | 8 | 10.29 |
| May | 9 | 9.96 |
| May | 10 | 4.88 |
| May | 11 | 8.76 |
| May | 12 | 9.63 |
| May | 13 | 10.13 |
| May | 14 | 6.74 |
| May | 15 | 6.64 |
| May | 16 | 5.99 |
| May | 17 | 7.19 |
| May | 18 | 5.35 |
| May | 19 | 6.78 |
| May | 20 | 3.46 |
| May | 21 | 6.85 |
| May | 22 | 2.81 |
| May | 23 | 2.12 |
| May | 24 | 4.29 |
| May | 25 | 3.52 |
| May | 26 | 7.98 |
| May | 27 | 7.84 |
| May | 28 | 8.41 |
| May | 29 | 4.33 |
| May | 30 | 3.5 |
| May | 31 | 6.37 |
| Jun | 1 | 5.72 |
| Jun | 2 | 3.83 |
| Jun | 3 | 5.58 |
| Jun | 4 | 8.28 |
| Jun | 5 | 10.22 |
| Jun | 6 | 10.34 |
| Jun | 7 | 9.15 |
| Jun | 8 | 8.76 |
| Jun | 9 | 10.06 |
| Jun | 10 | 9.16 |
| Jun | 11 | 5.61 |
| Jun | 12 | 5.08 |
| Jun | 13 | 4.53 |
| Jun | 14 | 5.2 |
| Jun | 15 | 5.74 |
| Jun | 16 | 7.66 |
| Jun | 17 | 6.03 |
| Jun | 18 | 5.1 |
| Jun | 19 | 7.74 |
| Jun | 20 | 2.19 |
| Jun | 21 | 4.88 |
| Jun | 22 | 8.17 |
| Jun | 23 | 6.6 |
| Jun | 24 | 6.08 |
| Jun | 25 | 3.72 |
| Jun | 26 | 7.26 |
| Jun | 27 | 3.92 |
| Jun | 28 | 7.29 |
| Jun | 29 | 7.02 |
| Jun | 30 | 3.64 |
| Jul | 1 | 2.81 |
| Jul | 2 | 8.62 |
| Jul | 3 | 8.67 |
| Jul | 4 | 8.96 |
| Jul | 5 | 4.47 |
| Jul | 6 | 9.49 |
| Jul | 7 | 8.46 |
| Jul | 8 | 4.47 |
| Jul | 9 | 7.35 |
| Jul | 10 | 9.1 |
| Jul | 11 | 6.4 |
| Jul | 12 | 6.92 |
| Jul | 13 | 5.69 |
| Jul | 14 | 7.62 |
| Jul | 15 | 8.76 |
| Jul | 16 | 4.38 |
| Jul | 17 | 8.27 |
| Jul | 18 | 10.5 |
| Jul | 19 | 10.48 |
| Jul | 20 | 9.46 |
| Jul | 21 | 9.34 |
| Jul | 22 | 6.48 |
| Jul | 23 | 7.23 |
| Jul | 24 | 7.53 |
| Jul | 25 | 5.19 |
| Jul | 26 | 7.77 |
| Jul | 27 | 5.47 |
| Jul | 28 | 5.74 |
| Jul | 29 | 5.34 |
| Jul | 30 | 5.16 |
| Jul | 31 | 6.54 |
| Aug | 1 | 7.48 |
| Aug | 2 | 3.09 |
| Aug | 3 | 2.73 |
| Aug | 4 | 5.65 |
| Aug | 5 | 7.81 |
| Aug | 6 | 7.46 |
| Aug | 7 | 5.37 |
| Aug | 8 | 7.21 |
| Aug | 9 | 7.03 |
| Aug | 10 | 8.41 |
| Aug | 11 | 2.24 |
| Aug | 12 | 4.26 |
| Aug | 13 | 5.45 |
| Aug | 14 | 6.97 |
| Aug | 15 | 9.12 |
| Aug | 16 | 9.12 |
| Aug | 17 | 10.87 |
| Aug | 18 | 10.18 |
| Aug | 19 | 6.55 |
| Aug | 20 | 7.66 |
| Aug | 21 | 4.61 |
| Aug | 22 | 3.62 |
| Aug | 23 | 9.26 |
| Aug | 24 | 10.01 |
| Aug | 25 | 9.82 |
| Aug | 26 | 8.52 |
| Aug | 27 | 8.85 |
| Aug | 28 | 6.54 |
| Aug | 29 | 6.26 |
| Aug | 30 | 9.54 |
| Aug | 31 | 9.53 |
| Sep | 1 | 6.96 |
| Sep | 2 | 6.03 |
| Sep | 3 | 6.62 |
| Sep | 4 | 4.85 |
| Sep | 5 | 7.36 |
| Sep | 6 | 6.59 |
| Sep | 7 | 9.48 |
| Sep | 8 | 9.12 |
| Sep | 9 | 8.28 |
| Sep | 10 | 8.85 |
| Sep | 11 | 4.23 |
| Sep | 12 | 8.65 |
| Sep | 13 | 8.49 |
| Sep | 14 | 8.42 |
| Sep | 15 | 8.0 |
| Sep | 16 | 4.4 |
| Sep | 17 | 3.94 |
| Sep | 18 | 5.54 |
| Sep | 19 | 4.81 |
| Sep | 20 | 5.36 |
| Sep | 21 | 6.95 |
| Sep | 22 | 5.34 |
| Sep | 23 | 7.25 |
| Sep | 24 | 7.97 |
| Sep | 25 | 7.2 |
| Sep | 26 | 5.23 |
| Sep | 27 | 8.43 |
| Sep | 28 | 6.41 |
| Sep | 29 | 1.71 |
| Sep | 30 | 5.48 |
| Oct | 1 | 4.24 |
| Oct | 2 | 2.92 |
| Oct | 3 | 5.76 |
| Oct | 4 | 5.53 |
| Oct | 5 | 8.4 |
| Oct | 6 | 4.52 |
| Oct | 7 | 2.72 |
| Oct | 8 | 4.79 |
| Oct | 9 | 5.22 |
| Oct | 10 | 5.27 |
| Oct | 11 | 3.19 |
| Oct | 12 | 2.01 |
| Oct | 13 | 2.99 |
| Oct | 14 | 4.01 |
| Oct | 15 | 1.71 |
| Oct | 16 | 6.96 |
| Oct | 17 | 3.78 |
| Oct | 18 | 1.8 |
| Oct | 19 | 2.98 |
| Oct | 20 | 1.64 |
| Oct | 21 | 3.07 |
| Oct | 22 | 3.34 |
| Oct | 23 | 4.51 |
| Oct | 24 | 1.19 |
| Oct | 25 | 1.8 |
| Oct | 26 | 2.96 |
| Oct | 27 | 1.82 |
| Oct | 28 | 0.62 |
| Oct | 29 | 4.7 |
| Oct | 30 | 3.18 |
| Oct | 31 | 4.87 |
| Nov | 1 | 1.61 |
| Nov | 2 | 3.85 |
| Nov | 3 | 2.58 |
| Nov | 4 | 1.84 |
| Nov | 5 | 2.28 |
| Nov | 6 | 2.12 |
| Nov | 7 | 0.79 |
| Nov | 8 | 2.26 |
| Nov | 9 | 0.75 |
| Nov | 10 | 0.89 |
| Nov | 11 | 3.85 |
| Nov | 12 | 2.32 |
| Nov | 13 | 0.55 |
| Nov | 14 | 0.88 |
| Nov | 15 | 0.53 |
| Nov | 16 | 1.49 |
| Nov | 17 | 1.63 |
| Nov | 18 | 1.68 |
| Nov | 19 | 2.07 |
| Nov | 20 | 0.75 |
| Nov | 21 | 0.56 |
| Nov | 22 | 2.5 |
| Nov | 23 | 0.96 |
| Nov | 24 | 2.52 |
| Nov | 25 | 4.12 |
| Nov | 26 | 2.2 |
| Nov | 27 | 1.86 |
| Nov | 28 | 4.23 |
| Nov | 29 | 4.15 |
| Nov | 30 | 1.99 |
| Dec | 1 | 0.56 |
| Dec | 2 | 1.47 |
| Dec | 3 | 2.7 |
| Dec | 4 | 3.85 |
| Dec | 5 | 3.79 |
| Dec | 6 | 3.25 |
| Dec | 7 | 0.81 |
| Dec | 8 | 1.31 |
| Dec | 9 | 0.68 |
| Dec | 10 | 0.61 |
| Dec | 11 | 1.08 |
| Dec | 12 | 0.63 |
| Dec | 13 | 0.54 |
| Dec | 14 | 1.21 |
| Dec | 15 | 0.8 |
| Dec | 16 | 1.81 |
| Dec | 17 | 0.55 |
| Dec | 18 | 0.86 |
| Dec | 19 | 2.01 |
| Dec | 20 | 1.75 |
| Dec | 21 | 1.04 |
| Dec | 22 | 0.61 |
| Dec | 23 | 0.91 |
| Dec | 24 | 1.12 |
| Dec | 25 | 0.55 |
| Dec | 26 | 2.21 |
| Dec | 27 | 2.81 |
| Dec | 28 | 0.75 |
| Dec | 29 | 1.97 |
| Dec | 30 | 2.14 |
| Dec | 31 | 0.64 |
It is important to realise that, although this graph gives the solar electricity yield in absolute values (GWh), the total number of PV systems installed in the Netherlands is growing over time.
Solar power per day and per region
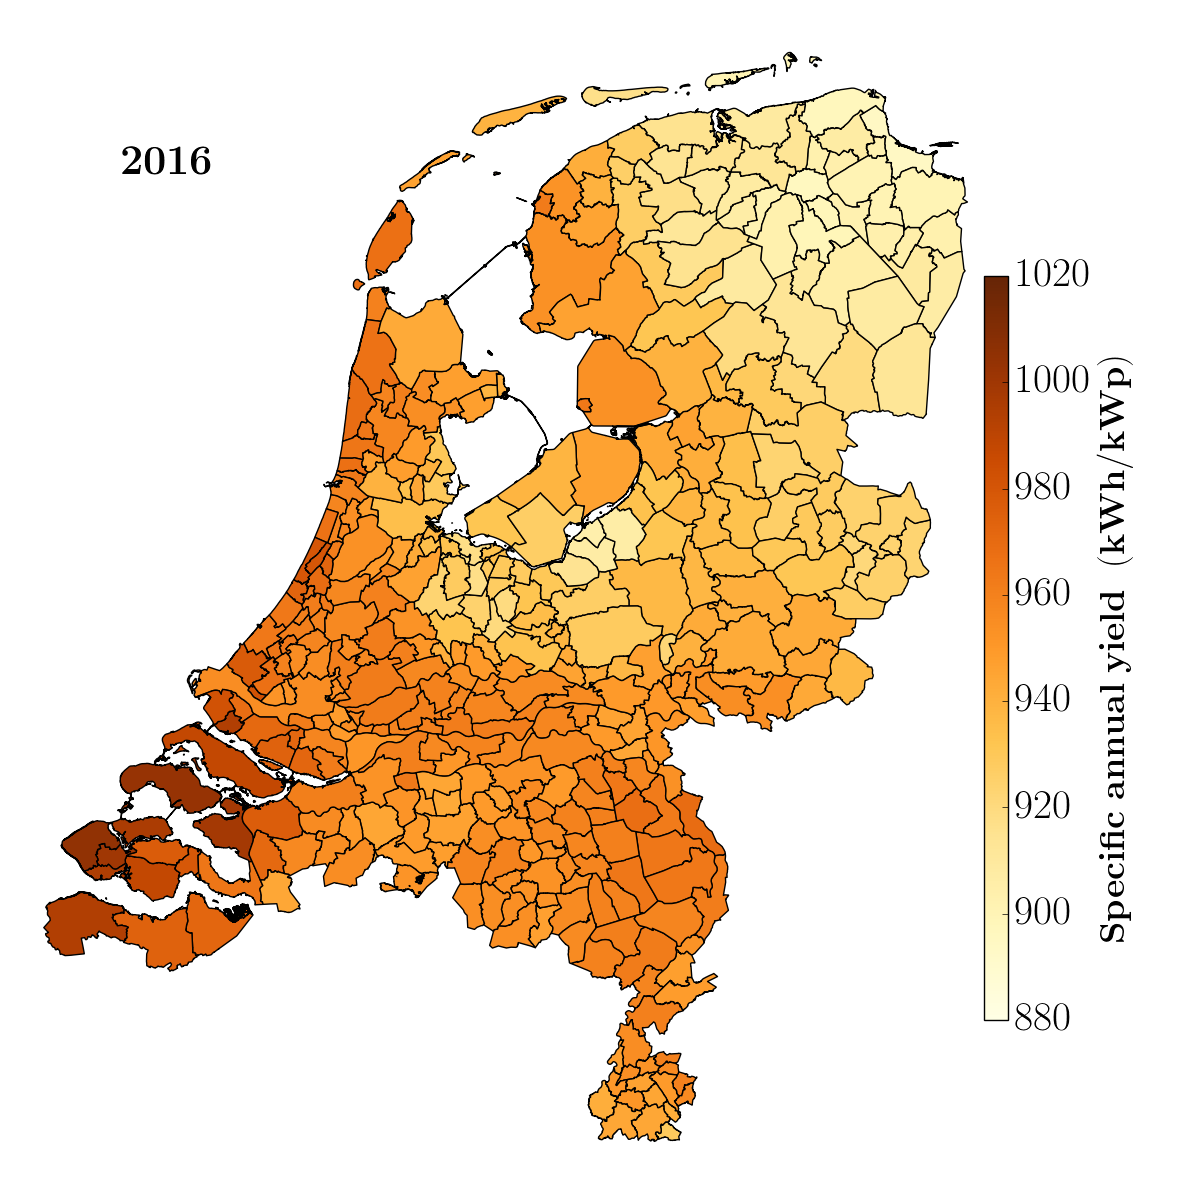
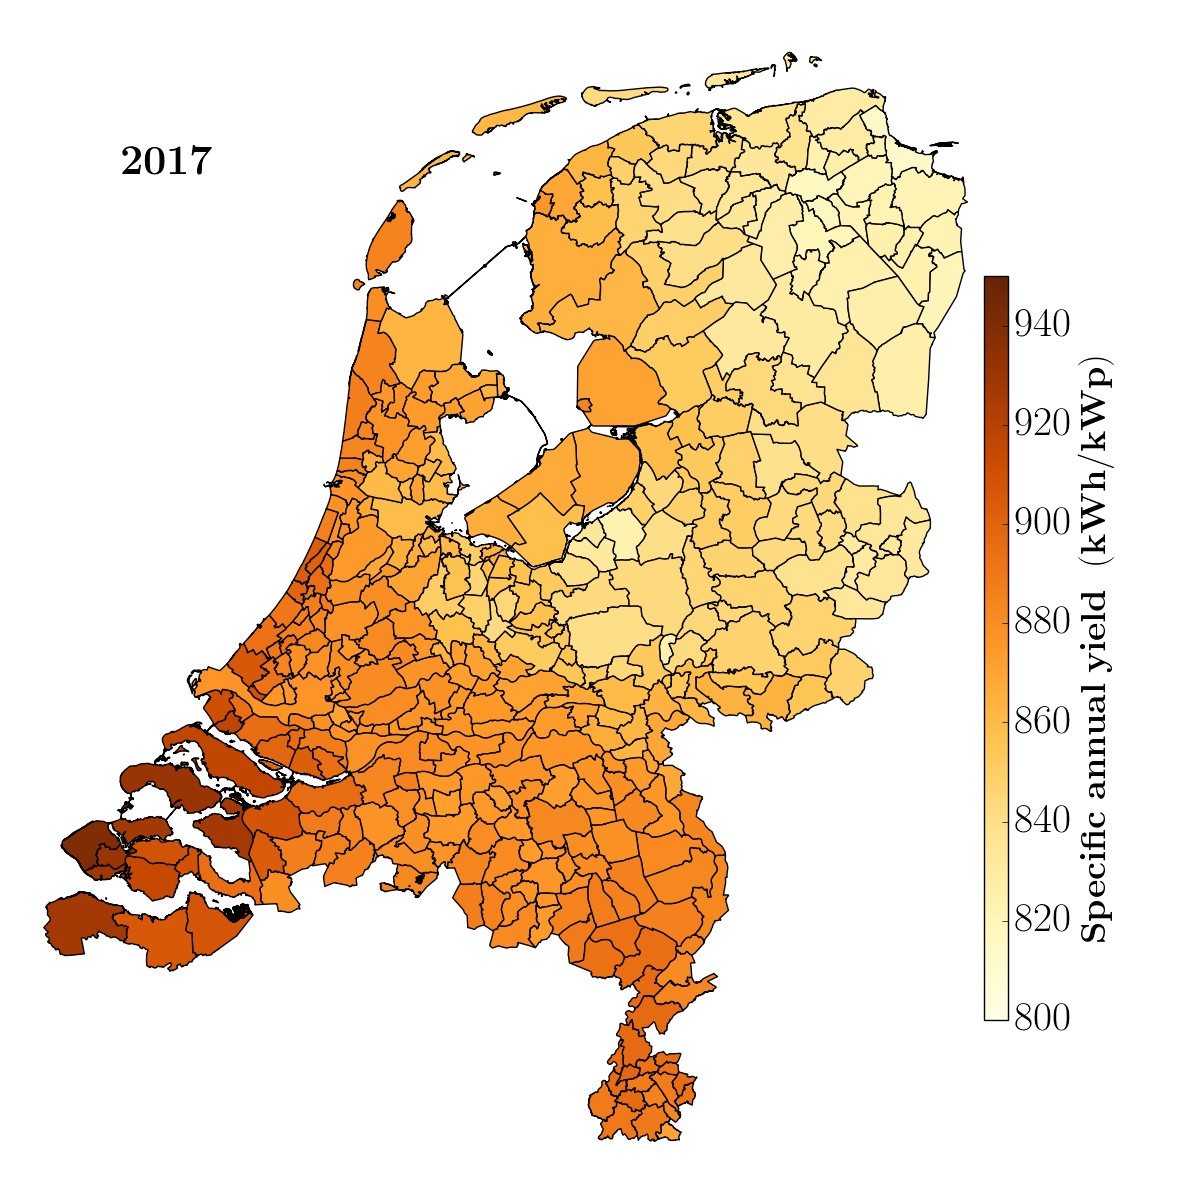
To obtain an estimate per region, the estimate of the solar power generated in the Netherlands each day has been translated into an estimate per municipality per day. This was achieved by comparing the local radiation with the average national radiation and distributing the yield proportionally among the municipalities. The figures below show the results for 2016 and 2017. According to these data, in both years, the Zeeland region had a relatively higher yield factor (energy generated per unit capacity) while that of Northeast Groningen was lower.
Using the same method, it is possible to estimate the solar energy yield per day and per region. These yields are displayed in two different visualisations, the first for all the days of 2016 and the second for one day of each week in that year. This method also shows that yields vary greatly from day to day and, on some days, also from region to region.
These two visualisations are available here.
Privacy
The radiation data do not contain any details that could be traced back to individuals or companies. The measurements from PVOutput are linked to the radiation data at the grid level to derive a probability function by time and by region. The data from PV systems are only published at an aggregated level and cannot be traced back to individual installations.
Feedback
This method can be further developed and applied to other, similar data. That is why Statistics Netherlands would like to know your opinion. Do you have any suggestions? Let us know using the form below.