Smart ways of monitoring solar power
Energy transition at national and regional level
Energy transition is high on the political agenda. At the end of February 2018, the Minister of Economic Affairs and Climate Policy set out the government’s approach to climate policy in a letter to the House of Representatives. The government’s goal is to cut greenhouse gas emissions by 49% (relative to 1990 emission levels) by 2030. The regions (local authorities, private citizens, businesses) have an important part to play in achieving the climate goals. CBS is studying new sources and methods that could be used to more effectively monitor the Netherlands’ energy transition. In this way, CBS wants to help make the energy transition measurable, both at regional and at national level.Current estimate based only on annual national figures
CBS’ current statistical analysis of solar power is based on a survey of approximately 350 companies that import and supply solar panels. Calculations of total solar power production are based on an estimate of installed capacity (installed panels) and on a fixed production value (875 kWh/kWp) per unit of installed capacity. This method involves an estimated uncertainty of 20 percent and can only provide yearly national figures. However, the energy transition is generating a demand for information at regional level and on shorter time scales. To this end, CBS is developing new methods for monitoring the amount of solar power being generated in greater detail.Measuring solar power at regional level
It is vital to get a complete picture of the total number of solar panels that have been installed, together with details of their location. Only then will it be possible to establish information resources at regional level. CBS has a range of existing administrative sources that, in combination with new sources, can generate detailed information on the locations and capacities of solar panels. A new source for CBS is the Production Installation Registry (PIR), which contains details of all solar panels in the Netherlands. We received this source from Energie Data Services Nederland (EDSN) and have combined it with existing data from the tax authorities about households reclaiming the VAT they paid on their solar panels. In addition, we were already making use of data on households’ annual electricity consumption and the Addresses and Buildings (BAG) registry.Growth in the number of domestic solar installations
We can use data from the PIR to illustrate the growth in the number of solar installations. The figures below illustrate the spectacular growth in solar panels since 2010, both in absolute numbers and at regional level. Note: this is restricted to small-scale consumption. Accordingly, it does not reflect the overall increase in the number of installations in the Netherlands, nor indeed the overall growth in the amount of solar power generated throughout the country.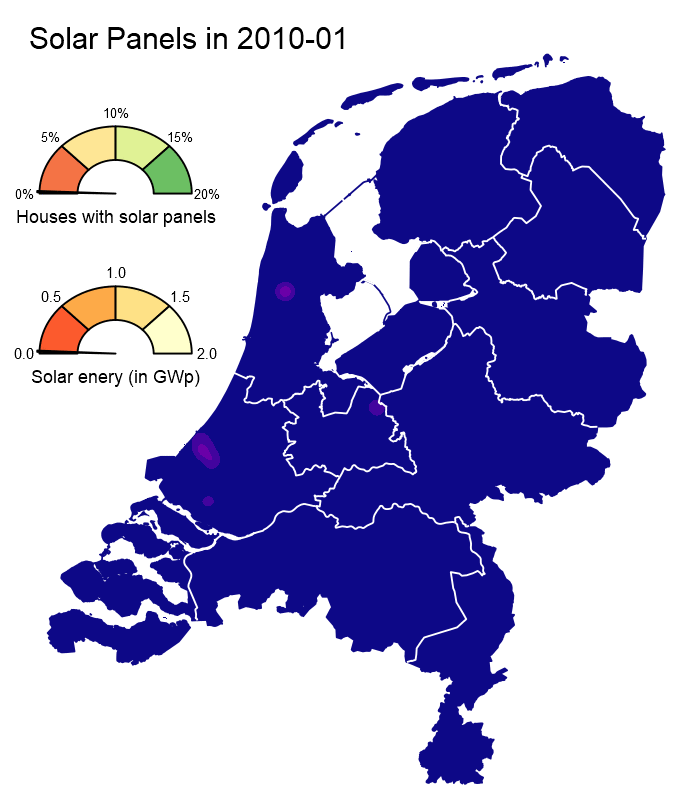
| jaar | maand | Newly installed solar panels: |
|---|---|---|
| 2010 | j | 261 |
| 2010 | f | 116 |
| 2010 | m | 182 |
| 2010 | a | 223 |
| 2010 | m | 197 |
| 2010 | j | 364 |
| 2010 | j | 310 |
| 2010 | a | 235 |
| 2010 | s | 293 |
| 2010 | o | 400 |
| 2010 | n | 299 |
| 2010 | d | 288 |
| 2011 | j | 400 |
| 2011 | f | 410 |
| 2011 | m | 521 |
| 2011 | a | 693 |
| 2011 | m | 735 |
| 2011 | j | 868 |
| 2011 | j | 870 |
| 2011 | a | 541 |
| 2011 | s | 731 |
| 2011 | o | 577 |
| 2011 | n | 695 |
| 2011 | d | 669 |
| 2012 | j | 723 |
| 2012 | f | 720 |
| 2012 | m | 1264 |
| 2012 | a | 1434 |
| 2012 | m | 1923 |
| 2012 | j | 2268 |
| 2012 | j | 3845 |
| 2012 | a | 4614 |
| 2012 | s | 6334 |
| 2012 | o | 6672 |
| 2012 | n | 5645 |
| 2012 | d | 4296 |
| 2013 | j | 3986 |
| 2013 | f | 4398 |
| 2013 | m | 6019 |
| 2013 | a | 7014 |
| 2013 | m | 7743 |
| 2013 | j | 8585 |
| 2013 | j | 8144 |
| 2013 | a | 6388 |
| 2013 | s | 6113 |
| 2013 | o | 4457 |
| 2013 | n | 4322 |
| 2013 | d | 4334 |
| 2014 | j | 4215 |
| 2014 | f | 4524 |
| 2014 | m | 5617 |
| 2014 | a | 5777 |
| 2014 | m | 6385 |
| 2014 | j | 6302 |
| 2014 | j | 7481 |
| 2014 | a | 5819 |
| 2014 | s | 5713 |
| 2014 | o | 6014 |
| 2014 | n | 5569 |
| 2014 | d | 5604 |
| 2015 | j | 5286 |
| 2015 | f | 5289 |
| 2015 | m | 7739 |
| 2015 | a | 8791 |
| 2015 | m | 9053 |
| 2015 | j | 10137 |
| 2015 | j | 8733 |
| 2015 | a | 6493 |
| 2015 | s | 7340 |
| 2015 | o | 7625 |
| 2015 | n | 7213 |
| 2015 | d | 6282 |
| 2016 | j | 6111 |
| 2016 | f | 6073 |
| 2016 | m | 7027 |
| 2016 | a | 7520 |
| 2016 | m | 7423 |
| 2016 | j | 8498 |
| 2016 | j | 8614 |
| 2016 | a | 5825 |
| 2016 | s | 6820 |
| 2016 | o | 7096 |
| 2016 | n | 7310 |
| 2016 | d | 5785 |
| Source: CBS, Production Installation Register (PIR) | ||
Distribution of solar panels between different types of homes
The link between new and existing administrative sources can also be used to determine the distribution of solar panels between different types of homes. Solar panels are significantly more common in owner-occupied homes (7.4%) than in rental properties (1.7%). On average, 4.93% of homes have solar panels, but this varies markedly from one type of home to another. Detached houses are most likely to have solar panels (in 11.72% of cases) and apartments the least likely (0.65%). See the illustration below for details of the percentage of installed solar panels in each type of home. In some cases, we were not able to obtain details of the type of home involved. It would be interesting to conduct a follow-up study, not only into the type of home involved, but also into the socio-economic status of their residents. Which groups are most likely to live in homes with solar panels?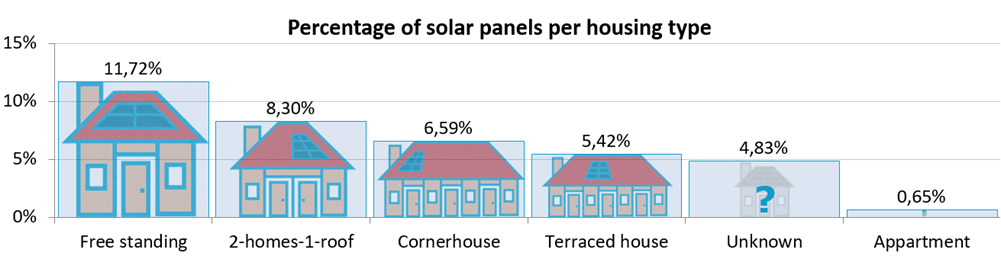
Regional statistics
CBS believes that, by making use of administrative sources in this way, it will be able to deliver better estimates of the amount of solar power being produced than it can using the current survey-based method. In addition, based on a survey funded by 40 Dutch local authorities and Netbeheer Nederland (the energy network operators’ branch association), CBS recently published details of solar power per local authority. This was the first time it has published data of this kind. In a later phase of this survey, the results of the data analysis concerning VAT refunds will be incorporated, together with data from the Netherlands Enterprise Agency’s (RVO) Energy Investment Allowance Scheme (EIA).Using big data sources to fine-tune the measurement of solar power
To further fine-tune its statistical analysis of solar power production, CBS wants to use big data sources to pin down the specific locations of solar panels and to determine the amount of solar power being effectively generated, per solar panel. Outline details of the study currently being carried out at CBS are given below. Individual publications will follow when the study has progressed to the point at which it is possible to provide more detailed information.Determining locations more accurately
CBS is conducting funded research at European level into the use of aerial photography to pinpoint solar panels. This will make it possible to establish the locations of solar panels with greater accuracy. CBS uses aerial photographs because those satellite images that are freely available do not have sufficient resolution to detect domestic solar panel installations. This research combines the use of artificial intelligence techniques and aerial photographs to automate the detection of solar panels. On this basis, we can work towards a harmonised method for accurately determining the number of solar panels in Europe as a whole. This additional resource is being used to validate and supplement our existing registry data.More accurate estimation of effectively generated solar power
In addition to pinpointing the locations of solar panels more accurately, we are working on two different methods for improving our estimates of the amount of solar power being effectively generated.
The first method uses public data (from PVOutput.org and other sources) to make reliable estimates of effective production per unit of installed capacity. This involves taking account of roof characteristics (slope and orientation), the site itself, and the weather conditions.
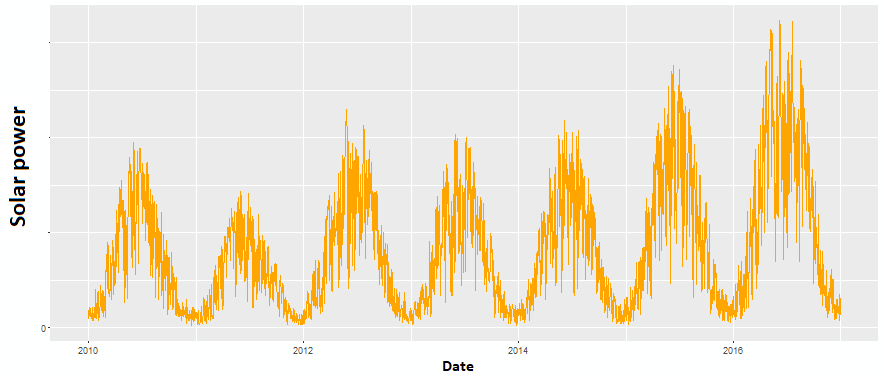
The second method uses advanced time series models to process data from the high-voltage power grid (Tennet) and solar radiation data from the Royal Netherlands Meteorological Institute (KNMI). Meteorological data on solar radiation is combined with high-frequency data on power consumption measurements for the Dutch high-voltage power grid. The concept underpinning these models is that if the solar panels are generating high yields then less power is supplied to the high-voltage grid and vice versa. In this way, a model can use these sources to indirectly derive a value for solar power. While the initial results give a plausible overall picture, better calibration is still needed. The model was supplied with data for the Netherlands as a whole, as this is freely available. However, this model can also be used at a lower (regional) level. At this level, the correlation between measured power consumption and meteorological data is expected to be even better, leading to more accurate models.
The figure below gives an initial impression of the development of solar power in the Netherlands in the period from 2010 to 2016.