Sensor data improves flash estimate for inland shipping
Statistics Netherlands (CBS) issues quarterly reports on the development of the Dutch economy. This is done on the basis of quarterly accounts. The quarterly accounts are part of the national accounts and provide a quantitative description of the economic process in the Netherlands and economic relations with foreign countries.
The quarterly accounts measure the size of the economy based on gross domestic product (GDP). The initial calculation of the quarterly accounts – known as the flash estimate – is made 45 days after the end of a quarter and published on the basis of the information available at that time. In issuing this estimate, CBS provides an initial growth figure for the Dutch economy. Following this early calculation, more and more information on the Dutch economy becomes available, which is then processed to produce new calculations. The final figures become available two and a half years after the end of the reporting year.
CBS works tirelessly to further improve flash estimates, partly through the use of new data sources. As part of these efforts, research has been carried out to see whether data from Rijkswaterstaat’s Information and Safety System (IVS) can be used to improve the added value and production value of inland shipping in the Netherlands.
Waterway data
Rijkswaterstaat is the government department responsible for the design, construction, management and maintenance of infrastructure in the Netherlands. Its IVS data are automatically collected at locks on the Dutch waterways, and include information on port of loading and unloading, type of vessel, and type of cargo. For a number of years, CBS has also incorporated this data in its figures on Dutch inland shipping.
During the study, a statistical model was developed to estimate the production value and the added value for inland shipping based on IVS data (Figure 1). The model values are shown as dotted lines, and the published CBS figures as solid lines.
For the period up to the end of 2015 (in red) the flash estimates have been revised at least twice. This period has been included to show the relationship between IVS data and final figures in a statistical model. The model was then used to estimate the final figures on the basis of IVS data for periods where the final figures were not yet available (green lines). The model-based estimates are close to the actual final value, and show less data noise after 2015 than the flash estimate. This suggests that IVS data can be used effectively to improve the flash estimate for inland shipping.
It should be noted that the shipping companies tracked using IVS data are not representative of the entire population of Dutch shipping companies included in the quarterly accounts. For this reason, the model is now being used for a test period and compared with independently determined flash estimates. Once the test is over, a well-founded decision on finally committing to the IVS system will be taken.
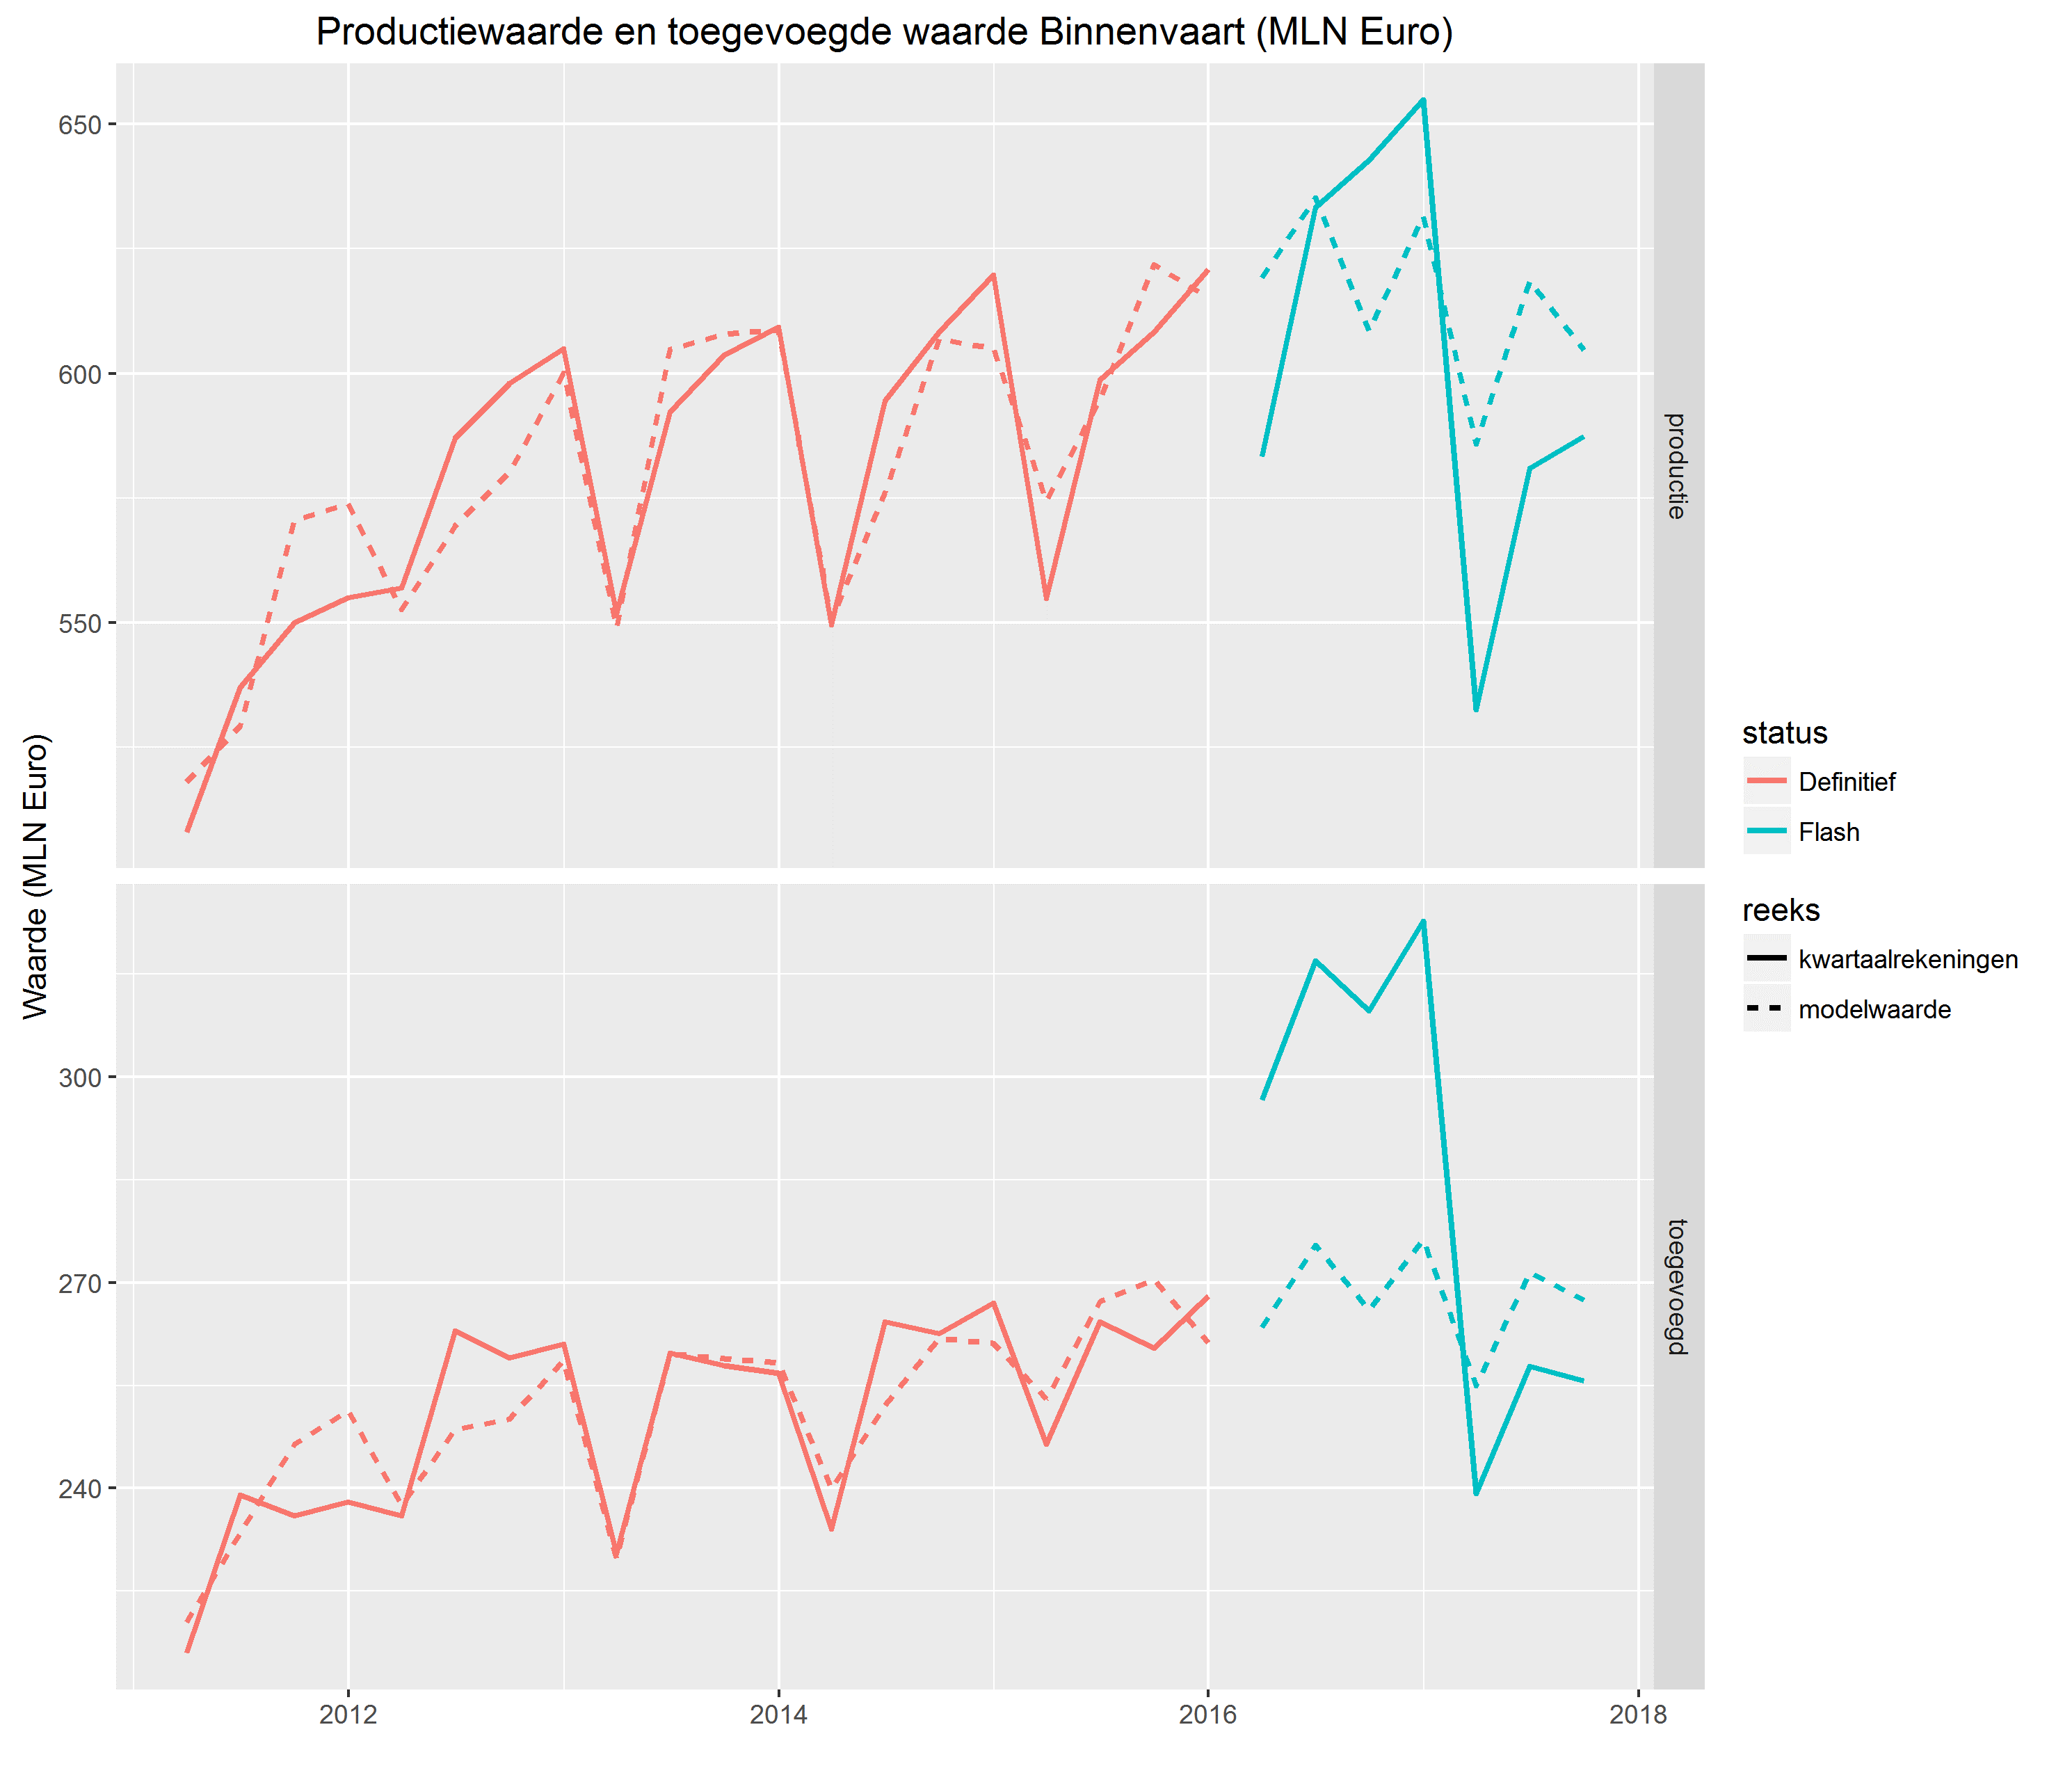
Figure 1. Final estimate and flash estimate for inland shipping (solid line), and the model-based estimates (dotted line)
Follow-up study
In addition to Rijkswaterstaat data for inland shipping, CBS is also exploring other new sources to improve flash estimates. For example, studies are currently being carried out to see whether supermarket transaction data can be used to provide more accurate estimates of household consumption in the Netherlands. These data cover customer transactions and therefore supermarket turnover, and are available on a weekly basis.
One of the greatest challenges is determining the influence of the last month of the quarter on the flash estimate. Flash estimates are produced at a moment when CBS has little or no data on the last month of the quarter. However, supermarket transaction data are already available for that last month. If a correlation can be found between the aggregate transaction data on a quarterly basis and the final estimate, this can be used to generate a more accurate flash estimate of household consumption and therefore a more reliable estimate of GDP. The results of this initiative will be presented in a forthcoming publication.
Alongside the study on the use of supermarket transaction data, research into the use of data from other readily available sources is also very promising; these include hardware stores and catering establishments. Certain sectors are particularly sensitive to shifts in the economic climate. These include consumer durables (e.g. equipment for the home, consumer electronics, cars and clothing) and services (e.g. catering and leisure). Finding readily available data sources for these sectors will be particularly useful when it comes to improving rapid GDP estimates.
Your feedback is welcome
If you have suggestions for readily available data sources, please get in touch. We would be delighted to hear from you.