Extracting data on road network transportation from sensor data without sample design
Introduction
Big data has received increasing attention across several disciplines in recent years. In official statistics, big data potentially enables us to produce statistics cheaper, faster, and on a higher level of detail. In contrast to traditional survey research, however, big data typically lacks a sampling design. The data generating mechanism is unknown. Not every element in the population has a known and positive probability of being observed. Correcting for selectivity using design-based inference methods is therefore not possible. New methodology is needed to use big data for population inference in official statistics.
In our application, we want to infer the truck traffic distribution in the Dutch road network from sensors. Not all road segments have sensors and road segments with sensors have not been randomly sampled. We therefore model the probability of detecting a truck as a function of features of the road segment. The model is then used to estimate the number of trucks on road segments without sensors. The presented results are preliminary and a first illustration of the idea.
Data
The statistics we would like to produce is the transport on the Dutch road network using sensor data without sampling design. The Dutch transport network was constructed by web scraping interchange road junctions (the vertices) and their connecting freeways (the directed edges) from www.wegenwiki.nl. Six vertex features were computed: degree, strength, betweenness, closeness, vulnerability and clustering coefficient, using the inverse haversine distance between vertices as the edge weight. Since the Netherlands is not an island but a transit country, more realistic vertex feature values were obtained by expanding the network with neighboring freeways in Belgium and the Northwest-German states North Rhine-Westphalia, Lower Saxony and Bremen.
In this road network, the Dutch ministry of infrastructure has installed a Weigh-in-Motion sensor system to detect overloaded trucks. The system consists of 18 sensors: nine locations with two sensors in either direction. Each sensor was assigned to an edge of the graph using its geolocation. When a truck passes a sensor station, it is weighed, classified, and a photograph of the front license plate is taken. Using the license plate as a unique identifier, we could link information about the truck and owner from the vehicle and enterprise registers. Out of the 36 million trucks recorded in 2015, 15 million could be linked. Since trucks could pass a station multiple times a day, the number is reduced to 14 million unique trucks. In this proof of concept, we restrict the data to a single week with the largest number of simultaneously working sensors. Other weeks will be added later to increase mass and to borrow strength from adjacent days.
Figure 1 shows the resulting graph. The Dutch part consists of 108 vertices and 284 edges.
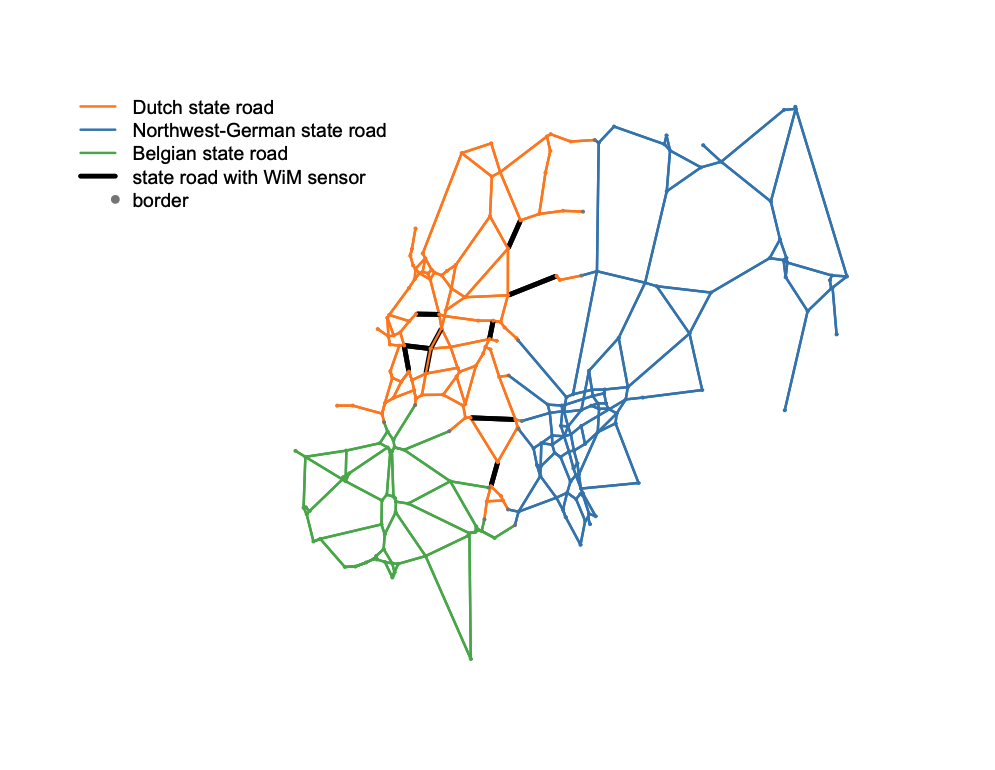
Figure 1.The transport network in geographical layout.
Methods
The probability of a truck driving on an edge of the Dutch freeway network on a given day is modeled using a generalized linear model (GLM) with logit link and binomial error distribution. In our first model, the logarithm of the odds is a linear combination of the features of the origin vertex, the destination vertex and the edge. The vertex features are degree, strength, betweenness, closeness, vulnerability and cluster coefficient. The edge feature is weight (inverse edge length (km−1)). Coefficients are estimated with the sensordata. The modeled relationship is used to estimate the detection probability for all network edges without a sensor. The estimated probabilities are multiplied with the number of trucks registered in the national vehicle register constituting the study population to derive the edge counts.
Preliminary Results
Figure 2 shows the estimated number of trucks driving on the Dutch road network on a given day. The graph, weighted by the modeled edge counts, shows to some extent routes to neighboring countries (Germany, Belgium), while truck traffic in parts of the center and the north seems to be lower. East-west and east-south transport is to be expected as the studied population includes a large proportion of heavy trucks. Such vehicles often take routes from the seaports in the west through the country into the rest of Europe. The relationship between predicted and actual edge counts is according to Pearson correlation coefficient very strong (r = 0.97). Cross validation shows that although the predictive model fits well it does not generalize well yet to other edges. Potential improvements will be discussed in the next section.
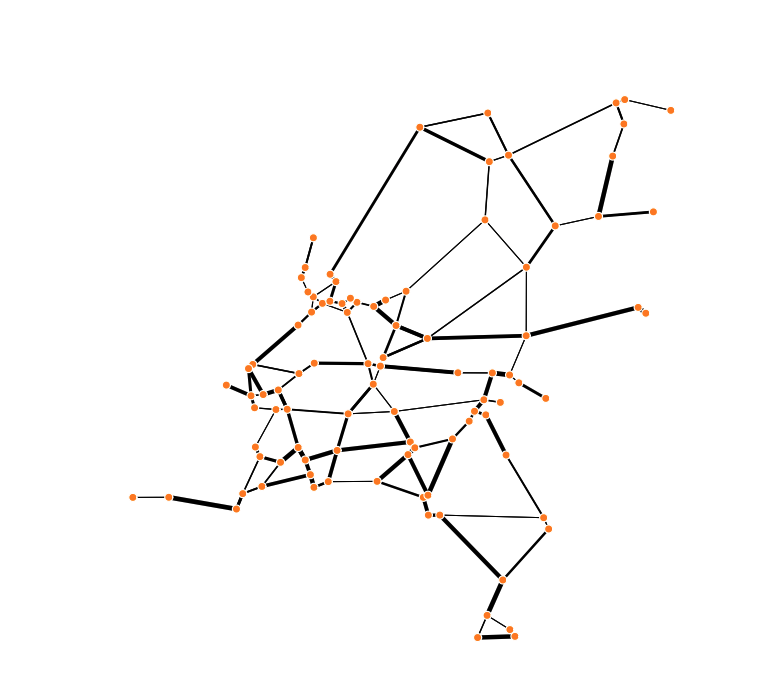
Figure 2. Model-based estimated truck traffic intensity in the Dutch road network based on sensor data. The thickness of edges corresponds to the estimated number of passing trucks.
Conclusions and Future Research
We demonstrated a potential method for the use of big data in official statistics. It could be used to infer the truck traffic intensity in a transport network from sensors installed on a non-probability sample of edges. An important assumption is that data is missing at random, i.e. missing data can be explained by network features of origin vertex, destination vertex and edge.
The proposed methodology can be expanded in several ways. First, the edge feature set can be extended with traffic intensity data from a more extensive road sensor system. This system consists of 24 thousand sensors, but without cameras to identify trucks. Data exploration showed similar time series of traffic patterns, which should make general traffic intensity an interesting potential predictor of truck driving behavior. Second, the models can be extended with several register features of trucks and owners. The cameras of the system allow linking these extra features. Third, the dataset can be extended with the entire time series to estimate coefficients more precisely and to exploit the dependency between days. These extensions are expected to reduce the generalization error. Fourth, we consider using an open Jackson network to account for the spatial dependency between edges. Finally, all features could be used to develop models for transported shipment weights.