Why does inflation feel so high?

In its press announcement of 5 August 2003 Statistics Netherlands reported that the figures for the period June 2002 to June 2003 are incorrect. Therefore the CPI figures in this publication are incorrect.
The press release of 9 September 2003 contains the corrected figures for the series for all households, and for the harmonised consumer price index.
Dutch inflation fell from 3.6 to 3.3 percent in May. Since December it has decreased by 1.1 percent points. Many consumers have been complaining about strong price increases since January. And not just in the Netherlands: in Germany, too, for example, there is an ongoing debate on inflation which consumers perceive to be very high. On 6 May Statistics Netherlands published a comparison between inflation as experienced by consumers and inflation as measured by the consumer price index. The present article attempts to explain the differences between these two.
Although inflation has fallen in the last few months, since December it has still been higher than in the last ten years, with the exception of 2001. In that year prices rose by more than they had done since 1982, partly as a consequence of a number of tax measures. The composition of inflation has differed greatly in the last few years. Recently the products with the highest prices have been those that consumers literally pay for out of their own pockets, and moreover that they buy on a weekly or even daily basis (e.g. food, and drink, flowers, hotels and restaurants clothes). Prices of other products on the other hand (rent, energy, petrol, cars, train tickets) have risen much less strongly or even sometimes decreased. As this category contains mainly products on which consumers spend a lot of money, the smaller price increases weigh relatively heavily in the calculation of the total average price index. What consumers notice, however, is that their day to day shopping costs much more and therefore they tend to overestimate actual inflation.
Inflation is high
First of all it must be said: the total rate of inflation in the Netherlands is still high. In 2001 it was 4.5 percent on average, the highest level since 1982. Although inflation is now lower than in 2001 and in May it fell to 3.3 percent, this is still higher than in the whole period 1993 to 2000.
Falling inflation hand in hand with rising prices
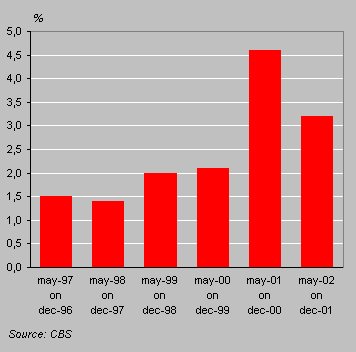
Although inflation fell between December and May, prices did rise. The price increase between December 2001 and May 2002 was 3.2 percent. This is less than between December 2000 and May 2001, but still clearly higher than in the preceding four years.
Price rises in five months
Inflation is the average of various developments
The official rate of inflation measures developments in the price of a complete package of goods and services on which consumers spend their money. The development in prices of the various components of this package have been very different in recent years, and are perhaps felt by consumers very differently. Below, the package is broken down into five groups, and the annual prices increases are analysed for each.
Energy
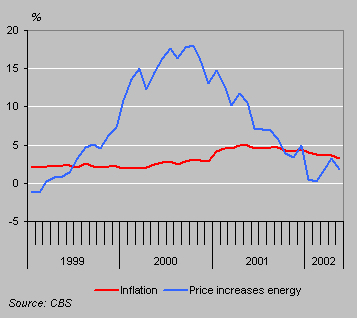
Prices of energy products fluctuate strongly. In the course of 2000 their contribution to inflation rose strongly. Since the beginning of 2001, however, the price increase compared with twelve months previously has dropped sharply. In the first months of 2002, the total rate of inflation was even restrained because motor fuels cost about 5 percent less than in the same months in 2001. Consumers do not notice energy prices on a daily basis, and apparently do not take the "profits" of cheaper petrol into consideration in their opinions on inflation.
General inflation and price increases for energy
Housing
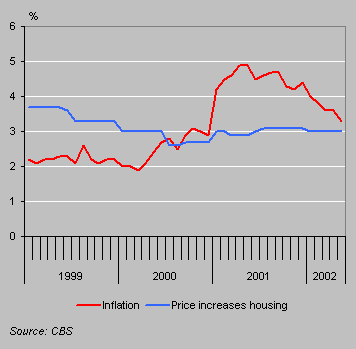
Spending on housing and housing-related taxes make up more than a quarter of the total consumption package. In general fluctuations in the inflation rate are dampened by price rises for housing, as price increases for this category are very constant. Moreover, prices for housing show a slightly downward trend. Until mid 2000 price developments for housing were above the average rate of inflation and thus pushed the rate up. Now that prices of other articles are rising more quickly, housing has a restraining effect on total inflation. Here, too, consumers are not confronted by the developments on a day to day basis.
General inflation and price increases for housing
Food, drink, tobacco, and hotels, restaurants, bars etc.
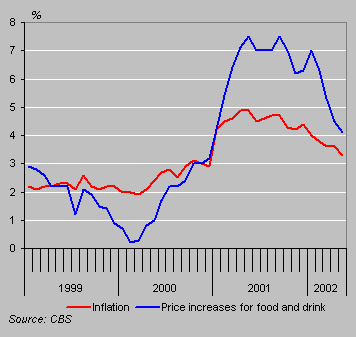
Food, drink, tobacco and purchases in hotels, restaurants, cafés, bars etc. are usually paid for directly out of consumers’ pockets. Consumers see what they pay on a daily or weekly basis. These are the products whose prices have surged in the last eighteen months, and this in itself is quite unusual. Prices of food and non-alcoholic beverages have often increased by a level below that of general inflation in the course of the years. Now that they have been rising so sharply, consumers seem to notice them more. Moreover, they notice it nearly every day.
General inflation and price increases for food and drink
Labour intensive services
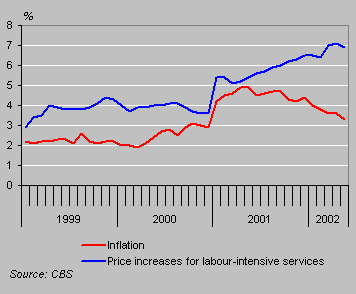
Prices of a number of labour intensive services in the area of repairs and maintenance have risen strongly in recent years. In 1999 and 2000 these prices increased by 4 percent annually on average. Since the beginning of 2001 this rate has increased, and in 2002 it is around 7 percent. A reduction in the rate of inflation for these items has not yet set in. It is a remarkable group in terms of price developments but its share in the total consumption package is reasonably small at around 5 percent of total expenditure. Its influence on the total rate of inflation is not very significant either, but again, consumers probably have a different perception of this.
General inflation and price increases for labour-intensive services
Other items
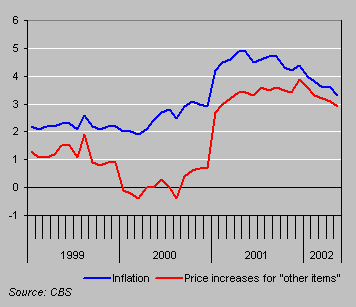
The group other items includes a variety of goods and services. Consumers will notice developments in prices of some of these items more than others. In 2000 the price increases for this group were very small, partly because of the abolition of the TV licence fee. At the beginning of 2001 increases became clearly larger and in the first months of 2002, too, price increases remained at a higher level than in recent years. Some items underwent even stronger price rises in the beginning of 2002 than in the beginning of 2001: clothes and shoes for example.
General inflation and price increases for other items
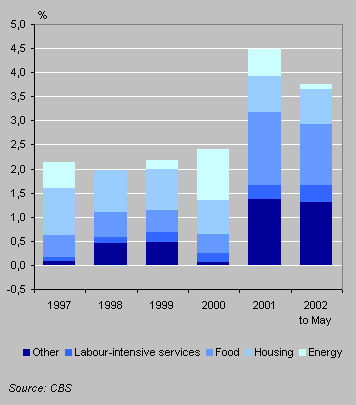
The last graph sums up the composition of inflation. The last three groups in particular have clearly contributed to the high rates of inflation in 2001 and 2002.
Composition of inflation
Jan Walschots