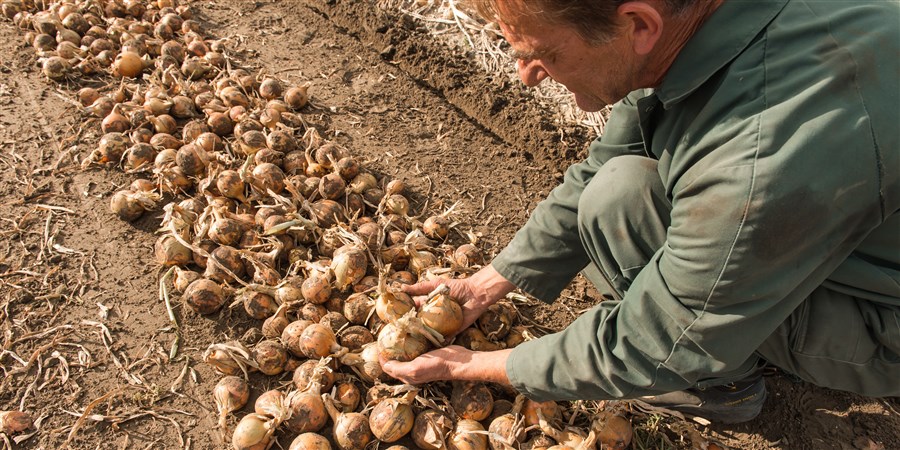
Gross seed onion yield down 17.2 percent
| Jaartal | Sugar beet (million tonnes) | Ware potatoes (million tonnes) | Seed onions (million tonnes) | Wheat (million tonnes) | Barley (million tonnes) |
|---|---|---|---|---|---|
| 2000 | 6.7 | 4.5 | 0.8 | 1.1 | 0.3 |
| 2001 | 5.9 | 3.6 | 0.8 | 1.0 | 0.4 |
| 2002 | 6.3 | 3.9 | 0.8 | 1.1 | 0.3 |
| 2003 | 6.2 | 3.2 | 0.8 | 1.1 | 0.3 |
| 2004 | 6.3 | 3.8 | 1.2 | 1.2 | 0.3 |
| 2005 | 5.9 | 3.2 | 1.0 | 1.2 | 0.3 |
| 2006 | 5.4 | 3.1 | 0.9 | 1.2 | 0.3 |
| 2007 | 5.5 | 3.6 | 1.1 | 1.0 | 0.3 |
| 2008 | 5.2 | 3.6 | 1.2 | 1.4 | 0.3 |
| 2009 | 5.7 | 3.6 | 1.2 | 1.4 | 0.3 |
| 2010 | 5.3 | 3.5 | 1.3 | 1.4 | 0.2 |
| 2011 | 5.9 | 3.9 | 1.6 | 1.2 | 0.2 |
| 2012 | 5.7 | 3.4 | 1.3 | 1.3 | 0.2 |
| 2013 | 5.7 | 3.5 | 1.2 | 1.3 | 0.2 |
| 2014 | 6.8 | 3.9 | 1.2 | 1.3 | 0.2 |
| 2015 | 4.9 | 3.3 | 1.4 | 1.3 | 0.2 |
| 2016 | 5.5 | 3.2 | 1.3 | 1.0 | 0.2 |
| 2017 | 8.0 | 4.0 | 1.5 | 1.1 | 0.2 |
| 2018 | 6.5 | 3.1 | 0.9 | 1.0 | 0.3 |
| 2019 | 6.6 | 3.7 | 1.4 | 1.2 | 0.2 |
| 2020 | 6.7 | 3.7 | 1.3 | 1.0 | 0.3 |
| 2021 | 6.6 | 3.3 | 1.5 | 1.0 | 0.2 |
| 2022* | 7.3 | 3.6 | 1.2 | 1.2 | 0.3 |
| *Provisional figures | |||||
According to the definitive crop estimates, in 2022 the gross yield of seed onions stood at 1.2 million tonnes, a 17.2-contraction on the previous year and the lowest yield since 2018. Altogether 1 million tonnes of yellow and 0.2 million tonnes of red onions were harvested. In addition, 268 thousand tonnes of plant onions were harvested.
In 2022, the gross ware potato yield stood at 3.6 million tonnes, representing an increase of 8.8 percent on the previous year. 7.3 million tonnes of sugar beet were harvested, an increase of almost 11 percent.
Wheat and barley yields up significantly
The gross wheat yield was almost one quarter higher than in 2021. The gross barley yield rose by 44.1 percent. The reason is that aside from the increase in cultivation area, the yield per hectare also increased.Growth in wheat and barley areas, decline in seed onion area
Relative to 2021, the wheat cultivation area increased by 4.2 percent to 124 thousand ha. The barley cultivation area also increased, by 22.6 percent to 36.9 thousand ha. The growth in cultivation area was mainly related to the sowing of summer wheat and summer barley. After an increase over the previous year, the seed onion cultivation area declined by 9 percent to 27.4 thousand ha.
The ware potato area grew again in 2022: by 7.3 percent to 76.6 thousand ha. This came after a decline over the two previous consecutive years. The sugar beet area rose slightly, by 1.3 percent.
| Jaartal | Wheat (1,000 ha) | Sugar beet (1,000 ha) | Ware potatoes (1,000 ha) | Seed onions (1,000 ha) | Barley (1,000 ha) |
|---|---|---|---|---|---|
| 2000 | 136.7 | 111.0 | 87.4 | 14.0 | 47.2 |
| 2001 | 124.7 | 109.1 | 75.9 | 14.2 | 66.8 |
| 2002 | 135.8 | 108.9 | 77.2 | 14.9 | 56.9 |
| 2003 | 129.9 | 102.8 | 70.6 | 16.4 | 55.0 |
| 2004 | 138.1 | 97.7 | 72.7 | 19.9 | 48.0 |
| 2005 | 136.7 | 91.3 | 65.8 | 16.8 | 50.6 |
| 2006 | 141.1 | 82.8 | 69.5 | 18.5 | 44.6 |
| 2007 | 141.3 | 82.0 | 72.5 | 20.1 | 46.0 |
| 2008 | 156.5 | 72.2 | 69.3 | 20.3 | 50.2 |
| 2009 | 151.0 | 72.7 | 70.5 | 19.5 | 44.5 |
| 2010 | 154.0 | 70.6 | 73.0 | 22.2 | 33.4 |
| 2011 | 151.5 | 73.3 | 72.6 | 23.3 | 34.1 |
| 2012 | 151.6 | 72.7 | 67.5 | 21.0 | 29.8 |
| 2013 | 152.8 | 73.2 | 71.6 | 22.0 | 29.6 |
| 2014 | 142.2 | 75.1 | 74.1 | 22.3 | 27.6 |
| 2015 | 142.5 | 58.4 | 71.7 | 23.9 | 32.8 |
| 2016 | 128.1 | 70.7 | 73.3 | 25.1 | 34.8 |
| 2017 | 116.4 | 85.4 | 76.3 | 26.7 | 30.2 |
| 2018 | 112.0 | 85.2 | 76.3 | 25.4 | 36.2 |
| 2019 | 121.1 | 79.2 | 78.9 | 27.6 | 33.7 |
| 2020 | 109.6 | 81.5 | 76.7 | 27.3 | 38.7 |
| 2021 | 119.4 | 80.7 | 71.4 | 30.1 | 30.1 |
| 2022* | 124.3 | 81.8 | 76.6 | 27.4 | 36.9 |
| *Provisional figures | |||||
Higher hectare yields of wheat and barley
The yields per hectare of wheat and barley rose substantially year on year in 2022. The wheat yield amounted to 9.6 tonnes per hectare (+17.3 percent). Of barley, 7.9 tonnes were harvested from one hectare last year; 17.1 percent more than a year earlier.
The yields per hectare of seed onions declined by 9.3 percent to 44.5 tonnes per ha. This is the lowest yield since 2018. The yield per hectare of sugar beet stood at 88.8 tonnes on average. This is 9.4 percent more than in the previous year. At 47.1 tonnes, the hectare yield of ware potatoes was up slightly on 2021.
| Jaartal | Sugar beet (tonnes) | Seed onions (tonnes) | Ware potatoes (tonnes) | Wheat (tonnes) | Barley (tonnes) |
|---|---|---|---|---|---|
| 2000 | 61.3 | 62.0 | 53.1 | 8.4 | 6.1 |
| 2001 | 55.4 | 54.2 | 47.9 | 8.0 | 5.9 |
| 2002 | 58.2 | 55.1 | 51.3 | 7.8 | 5.5 |
| 2003 | 60.7 | 49.4 | 46.0 | 8.8 | 6.4 |
| 2004 | 64.6 | 62.0 | 52.6 | 8.9 | 6.1 |
| 2005 | 65.3 | 58.6 | 49.0 | 8.7 | 6.2 |
| 2006 | 66.0 | 46.4 | 44.5 | 8.5 | 6.1 |
| 2007 | 67.1 | 54.2 | 49.9 | 7.2 | 5.7 |
| 2008 | 72.2 | 60.7 | 52.4 | 8.7 | 6.2 |
| 2009 | 78.9 | 62.6 | 51.8 | 9.3 | 7.0 |
| 2010 | 74.8 | 57.5 | 49.4 | 8.9 | 6.1 |
| 2011 | 79.9 | 68.2 | 53.4 | 7.8 | 6.0 |
| 2012 | 78.9 | 63.8 | 50.2 | 8.6 | 6.9 |
| 2013 | 78.2 | 54.6 | 48.6 | 8.7 | 7.0 |
| 2014 | 90.8 | 54.6 | 52.3 | 9.2 | 7.1 |
| 2015 | 83.3 | 57.4 | 46.4 | 9.1 | 7.0 |
| 2016 | 77.8 | 52.0 | 44.4 | 8.0 | 6.9 |
| 2017 | 93.3 | 55.7 | 52.8 | 9.1 | 6.9 |
| 2018 | 76.4 | 35.5 | 41.2 | 8.8 | 7.0 |
| 2019 | 83.9 | 50.3 | 47.9 | 9.6 | 7.4 |
| 2020 | 82.1 | 49.0 | 48.6 | 8.8 | 6.6 |
| 2021 | 81.2 | 49.1 | 46.7 | 8.2 | 6.8 |
| 2022* | 88.8 | 44.5 | 47.1 | 9.6 | 7.9 |
| *Provisional figures | |||||
Provisional and definitive crop estimates
Every year in October, CBS publishes provisional crop estimates (including gross yield and hectare yield), based on expert estimates of the expected crop yield per hectare. The total gross crop yield may ultimately be higher or lower. Due to weather conditions for instance, it is possible that part of the cultivated area is not harvested or that the final yields per hectare are higher or lower.
The definitive crop estimates (including gross yield and hectare yield) over the same year are subsequently published in January of the following year and based on a survey among nearly 5 thousand crop farmers. Based on the survey, the definitive yield per hectare is determined as well as the crop yield ratio, i.e. the actual over the potential harvest yield.
A separate StatLine table is published to indicate the discrepancies between the definitive and provisional crop estimates, alongside the StatLine table on crop production by region.
Sources
- StatLine - Arable crops; production, by region