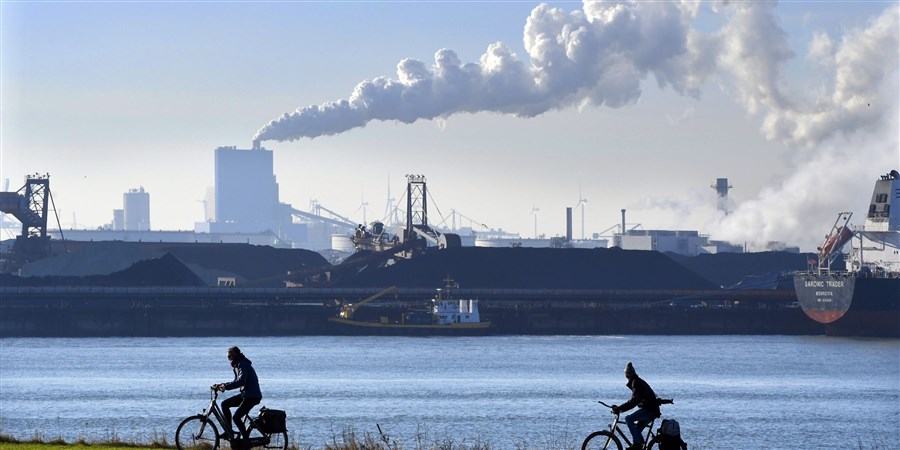
Dutch environmental footprint increases slightly
Environmental footprints illustrate the consequences of consumption by the Dutch population for the environment, regardless of whether the goods and services consumed are produced in or outside the Netherlands. In the Monitor, the greenhouse gas and material footprints are used as indicators for the effects of Dutch consumption patterns on the rest of the world.
In 2018 Dutch consumption resulted in average global greenhouse gas emissions of 15.8 tonnes of CO2 equivalents per capita. Since 2016, emissions of greenhouse gases by the Dutch economy have fallen by nearly 4 percent. The per capita greenhouse gas footprint on the other hand has risen by nearly 7 percent in the same period. One of the reasons for this is the increase in consumption by households and businesses.
Dutch consumption also results in emissions of greenhouse gases outside the Netherlands, namely in the places where the goods and services are produced which are purchased by Dutch consumers. Vice versa, the Netherlands also emits greenhouse gases for products made within the country and subsequently exported and consumed abroad. The balance of these emissions – imports minus exports - was positive in the period 2008–2018. This means that more greenhouse gases are emitted abroad on behalf of Dutch consumers than the other way around. The emission surplus fell between 2008 and 2016, from 5.5 tonnes to just over 1.2 tonnes of CO2 equivalents per capita. Rising consumption has more than doubled this surplus since 2016, to 2.8 tonnes per capita in 2018.
| Emissions by Dutch economy (tonnes of CO2 equivalents per capita) | Emissions surplus (imports minus exports) (tonnes of CO2 equivalents per capita) | |
|---|---|---|
| 2008 | 14.4 | 5.5 |
| 2009 | ||
| 2010 | 14.6 | 3.5 |
| 2011 | ||
| 2012 | 13.5 | 3.7 |
| 2013 | ||
| 2014 | 13.1 | 2.7 |
| 2015 | 13.5 | 2 |
| 2016 | 13.5 | 1.2 |
| 2017* | 13.3 | 1.7 |
| 2018* | 13 | 2.8 |
| * Provisional figure 1) No data available for 2009, 2011 and 2013 | ||
Increase in use of raw materials, especially metals
The material footprint, which measures the input of raw materials on behalf of Dutch consumption, rose from 9.6 thousand kg per capita in 2016 to 9.7 thousand kg in 2017. In 2012 the average consumption of raw materials per capita on behalf of Dutch consumption was still 8.8 thousand kg. The growth is mainly accounted for by the increasing use of raw metallic materials. In 2017 this was on average just over 800 kg (93 percent) higher per capita than in 2012, although still lower than in 2010.
The use of fossil fuels energy carriers has also risen since 2012, by nearly 400 kg per capita to 3,900 kg in 2017. In spite of this, the total material footprint per capita was just over 10 percent smaller in 2017 than in 2010. This was mainly the result of a fall in the amount of minerals used of just over 1.1 thousand kg per capita.
| Fossil fuels (x 1,000 kg per capita) | Minerals (excl. metals) (x 1,000 kg per capita) | Biomass (x 1,000 kg per capita) | Metals (x 1,000 kg per capita) | |
|---|---|---|---|---|
| 2010 | 3.8 | 3.1 | 2.2 | 1.8 |
| 2012 | 3.5 | 2.5 | 1.9 | 0.9 |
| 2014 | 3.8 | 2.3 | 1.8 | 1.2 |
| 2016 | 4 | 2.3 | 2 | 1.2 |
| 2017* | 3.9 | 2 | 2.1 | 1.7 |
| *Provisional figure | ||||
Raw materials used exceed domestic extraction
At 9.7 thousand kg per capita, the Dutch material footprint far exceeds domestic extraction of raw materials, which was 6.6 thousand kg per capita in 2017. Dutch stocks of natural resources are limited: there is no metal ore in the Netherlands, oil reserves are small and extraction of natural gas in Groningen has increasingly been cut back in recent years. This means the Dutch economy is largely reliant on imported raw materials.
These imports deplete stocks of these resources in the countries of origin and therefore have a negative impact on well-being. In this context, well-being is defined as the quality of life of the present population of the Netherlands, and the impact this has on well-being of future generations and on people elsewhere in the world.
Sources
- Publication - Monitor of Well-being & SDGs 2019
Related items
- News release - Dutch GHG footprint larger in 2017
- News release - Slight drop in greenhouse gas emissions
- News release - Many aspects of well-being improving – but not all
- News release - Strong link between education level and well-being