Relatively more Dutch products in EU-15 exports
Dutch GDP amounted to 663 billion euros in 2014. Over 34 percent consisted of value added generated by the production of goods and services intended for exports. This is equivalent to exports minus imports which are processed in the exports. For example, iron ore from South America is used to produce Dutch steel which is then exported to Germany. In 1995, this represented a share of 32.8 percent. These shares are similar to those of other smaller, open economies in Europe such as Belgium, Denmark and Austria. Larger economies - including the United Kingdom, France and the United States - have a much smaller export dependency. There has been a notable increase in the importance of exports for Germany.
| Belgium (% of GDP) | Denmark (% of GDP) | France (% of GDP) | Germany (% of GDP) | Netherlands (% of GDP) | United Kingdom (% of GDP) | |
|---|---|---|---|---|---|---|
| 1995 | 34.1 | 28.5 | 18.8 | 19.0 | 32.8 | 23.2 |
| 1996 | 33.6 | 28.6 | 19.2 | 19.7 | 32.7 | 23.6 |
| 1997 | 34.9 | 28.5 | 21.1 | 21.4 | 33.3 | 23.1 |
| 1998 | 35.3 | 27.4 | 21.1 | 22.0 | 32.1 | 21.6 |
| 1999 | 35.3 | 29.1 | 21.0 | 22.2 | 31.9 | 21.1 |
| 2000 | 36.2 | 32.2 | 21.9 | 24.0 | 32.9 | 21.6 |
| 2001 | 36.7 | 32.4 | 22.0 | 25.0 | 31.2 | 21.0 |
| 2002 | 36.2 | 31.9 | 21.6 | 25.9 | 30.8 | 20.2 |
| 2003 | 35.1 | 30.8 | 20.6 | 25.6 | 29.9 | 20.6 |
| 2004 | 35.2 | 30.3 | 20.5 | 26.8 | 30.3 | 20.2 |
| 2005 | 34.4 | 31.8 | 20.3 | 28.3 | 31.0 | 20.4 |
| 2006 | 34.9 | 32.2 | 20.4 | 29.7 | 30.9 | 20.8 |
| 2007 | 35.2 | 32.4 | 20.2 | 31.3 | 31.0 | 21.2 |
| 2008 | 35.6 | 32.6 | 20.4 | 31.7 | 32.2 | 23.1 |
| 2009 | 33.2 | 30.2 | 18.4 | 27.9 | 29.8 | 22.5 |
| 2010 | 32.9 | 30.7 | 19.6 | 29.7 | 31.7 | 23.2 |
| 2011 | 33.3 | 31.0 | 20.3 | 30.6 | 32.9 | 24.4 |
| 2012 | 33.3 | 30.7 | 21.5 | 31.7 | 34.0 | 24.2 |
| 2013 | 33.6 | 31.2 | 21.6 | 31.5 | 34.3 | 24.5 |
| 2014 | 34.3 | 31.1 | 21.7 | 31.8 | 34.3 | 23.5 |
| Source: OECD | ||||||
Consumption of Dutch goods and services in the US and China more and more important
Although a growing share of Dutch GDP is due to exports, the origin of these revenues has changed compared to 1995. The share of the EU 15 as a final buyer is decreasing. In 1995, as much as 65 percent of total Dutch export revenues were due to consumption in these countries, versus 52 percent in 2014. In absolute terms, however, the Netherlands is earning more and more thanks to the EU 15, but its revenues from consumption in other countries see a relatively larger increase, leading to a declining share of the EU 15. Consumption of Dutch goods and services - or products which contain these - in the United States, Canada, Mexico (NAFTA) but also in Brazil, Russia, India, China and South Africa (BRICS) has become more important in particular. For example: exports of Dutch steel to Germany to be used in the production of cars. If these cars are sold in China, then this country is the ultimate consumer of goods with Dutch input. Since 1995, the EU 13 (those countries joining the EU in 2004 or afterwards) have also grown in importance as consumers of Dutch goods and services in this respect. Economic growth in these countries was relatively strong compared to the EU 15.
| EU-15 (%) | EU-13 (%) | NAFTA (%) | BRICS (%) | APEC (%) | Rest of the world (%) | |
|---|---|---|---|---|---|---|
| 2014 | 52.1 | 3.9 | 11.3 | 9.4 | 9.8 | 13.6 |
| 1995 | 64.3 | 2.2 | 7.9 | 3.5 | 8.9 | 13.3 |
| Source: CBS, calculation based on OECD data | ||||||
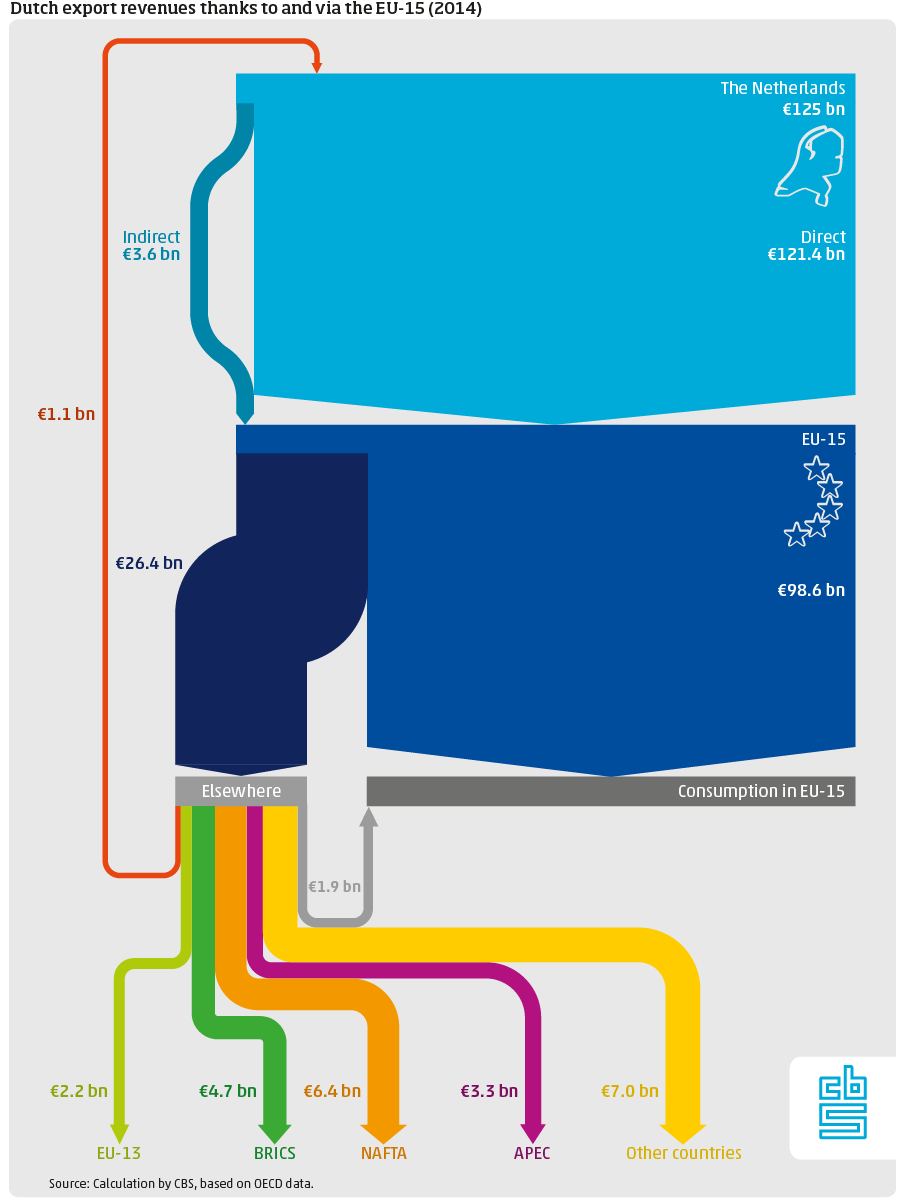
EU 15 as gateway to the rest of the world
In 2014, the Netherlands earned 125 billion euros in exports of goods and services destined for the EU 15. Over 81 percent of these revenues arose from consumption of Dutch goods and services in these countries. The remaining share - 19 percent - is on account of Dutch goods and services that are processed into other goods and services within the EU 15. These were subsequently exported and consumed elsewhere (neither in the EU 15 nor in the Netherlands). In 1995, this remaining share constituted just under 10 percent of Dutch revenues thanks to direct exports to the EU 15. This gateway function of the EU 15 in the transfer of Dutch goods and services to the rest of the world has become more important over the past twenty years.
Sources
- Publication - Internationalisation Monitor 2018, first quarter