Children’s intake of fruit, veg and fish is too low
| Fruit (%) | Vegetables (%) | Fish (%) | |
|---|---|---|---|
| 38.15 | 41.73 | 52.63 | |
| Source: CBS, RIVM, Netherlands Nutrition Centre | |||
| * Wheel of Five | |||
In this survey, parents and carers answer questions regarding the quantities of fruit, vegetables and fish their child consumes. The reported quantities are then compared with the guidelines of the Netherlands Nutrition Centre (more specifically, the ‘Wheel of Five’ which is the Dutch equivalent of the food guide pyramid), based on the 2015 dietary guidelines by the Health Council of the Netherlands (Gezondheidsraad).
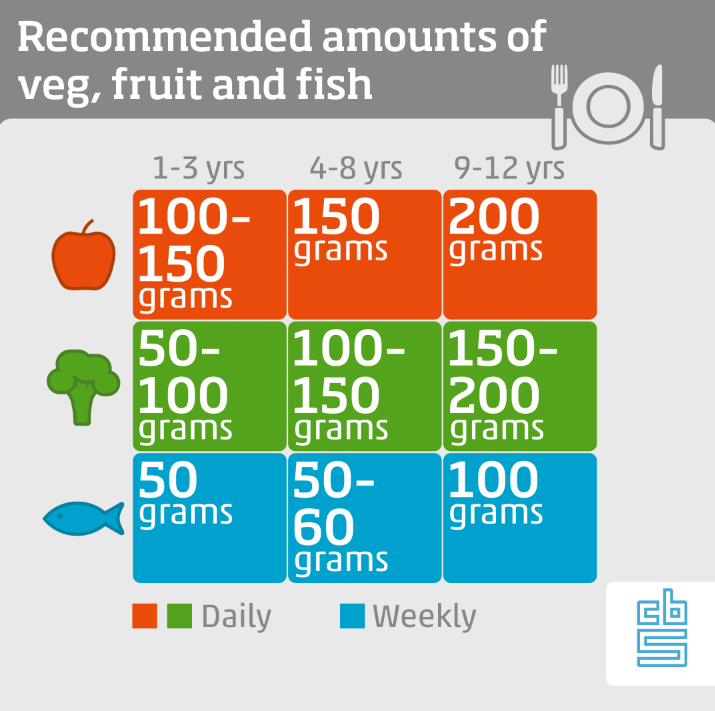
According to the guidelines, almost 4 out of 10 children between the ages of 1 and 11 ate sufficient quantities of fruit in the period 2014/2016, while more than 4 out of 10 children ate sufficient vegetables. Slightly over half of children in this age group ate enough fish according to the existing guidelines.
Younger children have higher intake of fruit, veg and fish
Younger children are more likely to eat sufficient fruit, vegetables and fish than older children in the group. In 2014/2016, almost half of those aged 1 to 3 years ate enough fruit. This share was lower among children aged 4 to 8 years (over 4 in 10) and 9 to 11 years (2 in 10). Similar proportions were seen for the intake of vegetables and fish. The share of children eating enough vegetables is twice as large among children aged 1-3 compared to children aged 9-11. The differences are smaller in terms of fish consumption.
| 1-3 yrs (%) | 4-8 yrs (%) | 9-11 yrs (%) | |
|---|---|---|---|
| Fruit | 49.56 | 41.95 | 20.24 |
| Vegetables | 59.00 | 41.26 | 25.06 |
| Fish | 55.64 | 52.82 | 49.27 |
| Source: CBS, RIVM, Netherlands Nutrition Centre | |||
| * Wheel of Five | |||
Children with highly educated parents have a healthier diet
Children aged 1 to 11 years with parents or carers who have a high education level are more likely to meet nutritional standards than children with medium or low-educated parents. The intake of fruit, for instance, is in line with the recommended daily intake among over 4 in 10 children with highly educated parents against over 3 in 10 children with low-educated parents.
Food consumption by children (1-11 yrs) according to nutritional standards*, by education level of parent/carer, 2014/2016 Low (%) Medium (%) High (%) Fruit 32.51 36.14 43.16 Vegetables 38.00 39.72 46.28 Fish 50.24 48.38 58.36 Source: CBS, RIVM, Netherlands Nutrition Centre * Wheel of Five
| Low (%) | Medium (%) | High (%) | |
|---|---|---|---|
| Fruit | 32.51 | 36.14 | 43.16 |
| Vegetables | 38.00 | 39.72 | 46.28 |
| Fish | 50.24 | 48.38 | 58.36 |
| Source: CBS, RIVM, Netherlands Nutrition Centre | |||
| * Wheel of Five | |||
About the Health Survey/Lifestyle Monitor
CBS conducts the Health Survey/Lifestyle Monitor once a year in collaboration with the National Institute for Public Health and the Environment (RIVM) and the Netherlands Nutrition Centre (Voedingscentrum). The aim of the health/lifestyle survey is to collect accurate information on the the Dutch population from age 0 living at home pertaining to health, lifestyle, health care use and preventive behaviour. This survey includes the measurement of dietary and nutritional habits by posing specific questions on their consumption of fruit, vegetables and fish. Questions on nutrition and diet are targeted at all respondents aged 1 and over. The questions are answered by a parent/carer for all children under the age of 12. Every year, approximately 1,100 children between the ages of 1 and 12 participate in this survey. An alternative route for mapping of food intake is the so-called 24-hour food intake enquiry, a method which is applied in the Food Intake Survey, an additional component of the Lifestyle Monitor Survey. The Food Intake Survey provides a more accurate picture of food intake but is conducted among a smaller group of people and less frequently than the Health Survey. The most recent Food Intake Survey shows that even fewer children had sufficient fruit and vegetable intake than is shown in the Health Survey.