Economy EU-25: bigger, more varied, but poorer

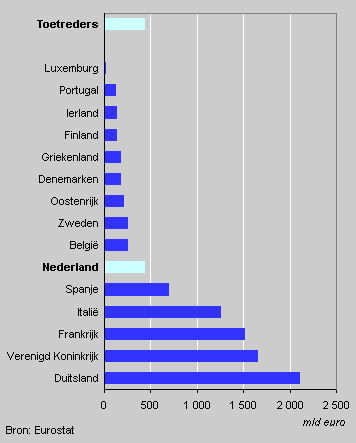
The European product (GDP) of the EU-15 rose by 440 billion euro to 9.6 trillion euro (2002 figures) when the ten new countries joined on 1 May. The new countries contribute only modestly to the European product: they account for less than 5 percent of the GDP of the EU-25.
German economy largest
The contributions to the European GDP differ very substantially between the member countries. Germany accounts for 22 percent of the European GDP and is the largest economy, followed by the United Kingdom (17 percent) and France (16 percent).
GDP, 2002

Modern and traditional services
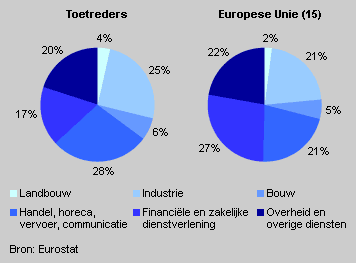
The economies of the fifteen countries making up the EU until 1 May differ strongly from those of the newcomers. The EU-15 have modern services-based economies: more than 70 percent of GDP is generated in the services sector. Financial and business services such as banks, insurance companies, employment agencies, computer bureaus, advertising agencies and economic and legal consultancies account for the largest part of the services sector. The financial and business services is sector was the largest sector in the economy of the EU-15 (27 percent of GDP). Manufacturing (21 percent of GDP), trade and transport (21 percent) and government and care sector (22 percent) are smaller.
Manufacturing biggest in new countries
The services sector is smaller in the ten new countries (65 percent of GDP) and in none of them is it the largest sector. In four of the ten accession countries manufacturing is the largest sector, in the other six it is trade (including hotels and restaurants, transport and communication). Manufacturing accounts for an average 25 percent of GDP in the new countries, trade for an average 28 percent. Financial and business services are winning ground in these countries though.
Production structure, 2002

New EU countries not so rich
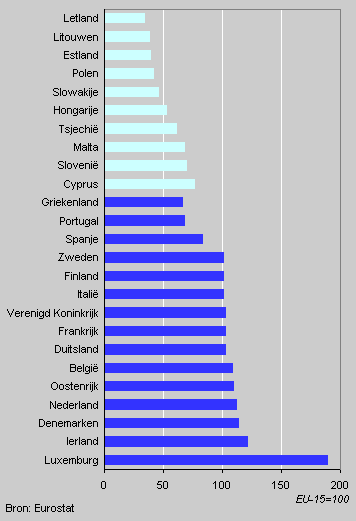
Since the new countries joined on 1 May, the EU has become less rich as a whole: GDP per capita fell by 13 percent form an average 24.2 thousand euro in the EU-15 to 21.2 thousand euro in the EU-25 (2002 figures).
After correction for differences in purchasing power, average per capita GDP in the ten new countries was only half that in the EU-15.
GDP per capita, purchasing power parities, 2002

Hermanus Rietveld and Gert Jan van Steeg